





I spent a year as the product manager for GitLab CI in 2017/2018, working on caching and runner sizing. When Abir Taheer offered to show me how he made Composio's CI faster, I asked him to walk me through the data.
Every PR and commit to our main repo used to wait around seven minutes for CI. Seven minutes was enough to break your concentration without giving you time to do anything useful. Now our Vitest suite runs in three shards that each finish in about two minutes, even though the number of tests has roughly doubled since Abir started.
The chart that showed where the time went
We run CI on Depot's GitHub Actions runners, which give us CPU and memory graphs for every job.
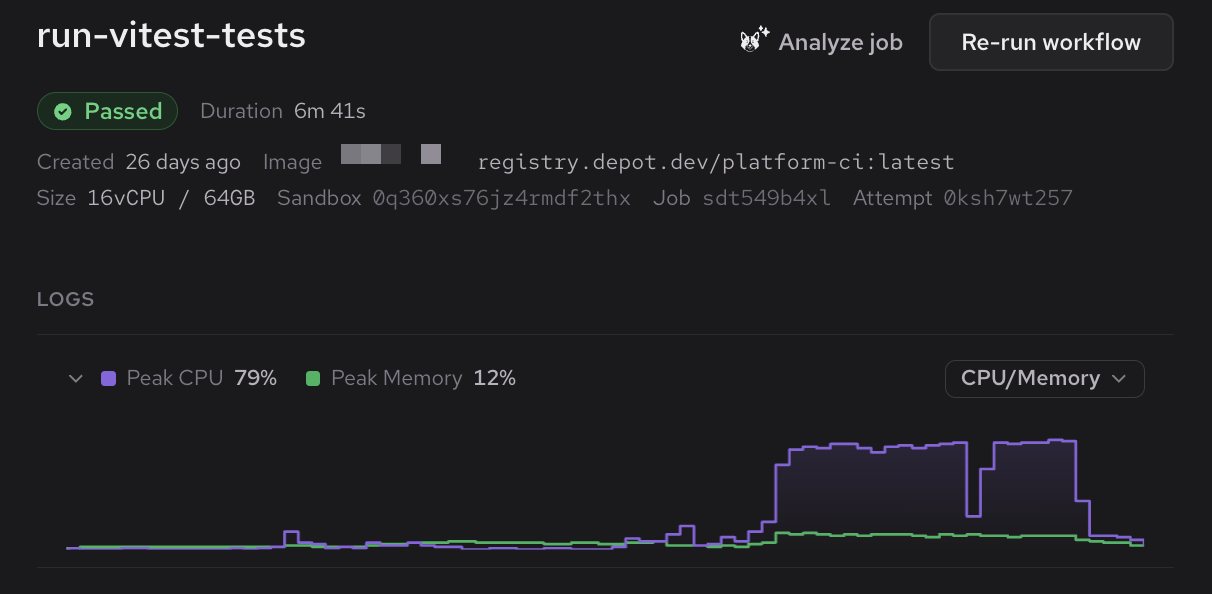
For more than half the Vitest run, CPU sat near zero. We were paying for sixteen cores while the job waited on network and disk I/O.
A bigger runner is cost-effective only when the job can use the additional cores. Otherwise, you pay a higher per-minute rate without a proportional reduction in runtime.
Abir looked for flat stretches after each run and moved more setup work earlier so the tests could start sooner.
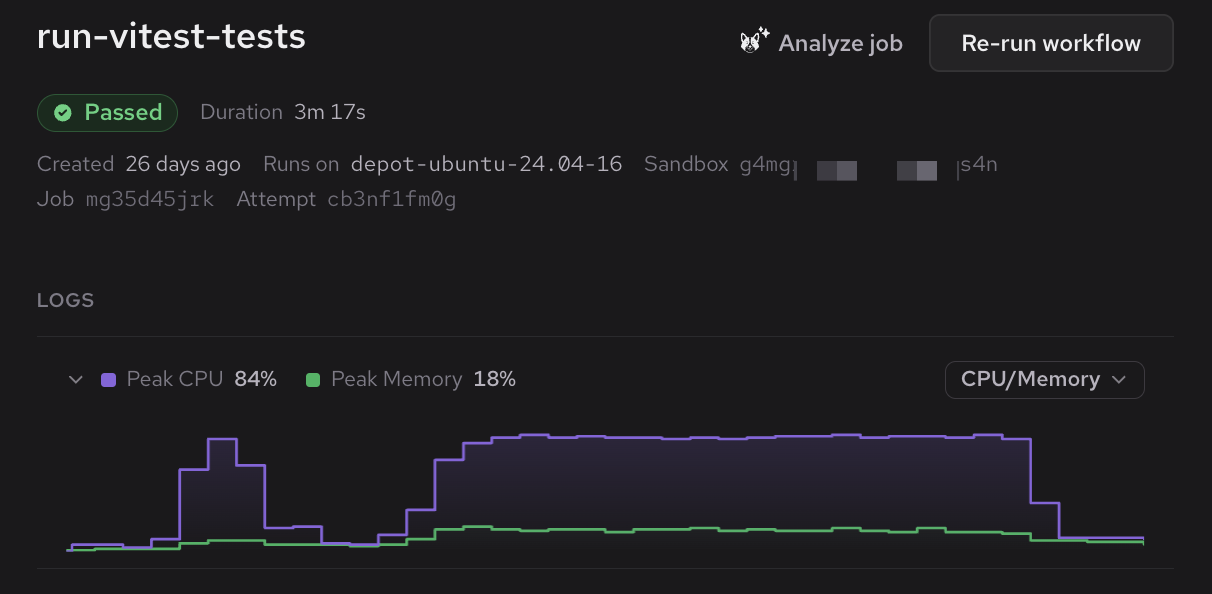
Start everything early and wait only when you have to
The original job ran as a straight line. Install npm packages, install Go dependencies, seed the database, start the app, run the tests. Each step waited for the one before it, even when the two had nothing to do with each other.
Abir's first change was to start every install at the top of the job using shell backgrounding. Database seeding and the rest of the setup happened while the installs were still going. When a step actually needed node_modules, it checked whether the install had finished, and by then it usually had.
That change alone took a typical PR run from about seven minutes to about four and a half.
GitHub announced native background steps on June 25, 2026. We've since moved most of this work to background: true and wait. This trimmed excerpt from apollo-vitest-e2e.yaml fetches the shared Docker image for Thermos, our Go orchestration service, while toolchain and database setup continue. Checkout, conditions, and intervening steps are omitted.
# Poll the sibling builder without a needs dependency so image retrieval
# overlaps this shard's toolchain and database setup.
- name: Fetch Thermos image
  id: thermos-build
  timeout-minutes: 16
  env:
    GH_TOKEN: ${{ github.token }}
  run: |
    set -euo pipefail
    bash .github/scripts/fetch-run-artifact.sh thermos-ci-image-vitest "Build Thermos (shared)" /tmp/thermos-artifact
    zstd -dc /tmp/thermos-artifact/thermos-ci.tar.zst | docker load
    docker image inspect thermos:ci --format 'Loaded thermos:ci ({{.Id}})'
  background: true

# Toolchain setup, database migrations, and seeding run here.

- name: Wait for Thermos image
  wait: thermos-build
background: true starts the step and lets subsequent setup steps continue. Our fetch-run-artifact.sh helper polls the sibling builder without a needs dependency that would hold up the entire shard. It downloads the image when it becomes available, then loads it into Docker.
Just before a step needs Thermos, wait: thermos-build blocks until the fetch and load finish. If the background step fails, the wait step fails too. GitHub handles that coordination, so we no longer need the old shell approach's exit-status file and polling loop.
Give your dependency cache a fallback
A lockfile change invalidates the exact dependency-cache key, even if the PR adds only one package. A fallback lets the install reuse packages from an older cache.
Our reusable Playwright workflow caches the pnpm store, where downloaded packages live. After pnpm setup, it runs these steps:
- name: Get pnpm store directory
  id: pnpm-cache
  shell: bash
  run: |
    echo "STORE_PATH=$(pnpm store path)" >> $GITHUB_OUTPUT
- name: Setup pnpm cache
  uses: actions/cache@668228422ae6a00e4ad889ee87cd7109ec5666a7 # v5.0.4
  with:
    path: ${{ steps.pnpm-cache.outputs.STORE_PATH }}
    key: ${{ runner.os }}-pnpm-store-${{ hashFiles('**/pnpm-lock.yaml') }}
    restore-keys: |
      ${{ runner.os }}-pnpm-store-
The fallback prefix omits the lockfile hash. GitHub searches the current branch first, then the default branch, as described in its cache lookup rules. There is no explicit master key. The install still runs, but can reuse cached packages and download what's missing. A successful job saves the store under the new lockfile key.
The PR that added this cache change, along with the first round of sharding, took the run from four minutes to two and a half.
Sharding Vitest and overcommitting workers
After backgrounding setup and improving the cache, further single-runner optimizations produced little benefit. The Vitest suite still ran as one job, and all of it was CPU-bound.
The integration workflow splits the suite into three shards on 16-vCPU runners. This example shows the matrix and test command with Abir's recommended fail-fast: true setting. Setup steps, environment variables, and the Doppler wrapper are omitted:
jobs:
  run-vitest-shards:
    name: run-vitest-tests (${{ matrix.shard }}/3)
    runs-on: depot-ubuntu-24.04-16
    strategy:
      fail-fast: true
      matrix:
        shard: [1, 2, 3]
    steps:
      # Setup omitted.
      - name: Run Vitest tests
        run: pnpm --filter @composio/apollo test:unit --shard=${{ matrix.shard }}/3 --maxWorkers=175%
The test:unit script invokes Vitest. Each shard gets a share of the test files. With fail-fast: true, GitHub cancels the remaining queued or running matrix jobs when one fails, avoiding more work on an already-failing run. Use fail-fast: false when you want every shard's diagnostics instead.
Abir also increased the worker count. Some tests spend part of their time waiting on database and service I/O, leaving room for other tests to run. The current workflow sets --maxWorkers=175%, or 1.75 workers per vCPU. The right ratio depends on your suite, so measure it on yours before copying ours.
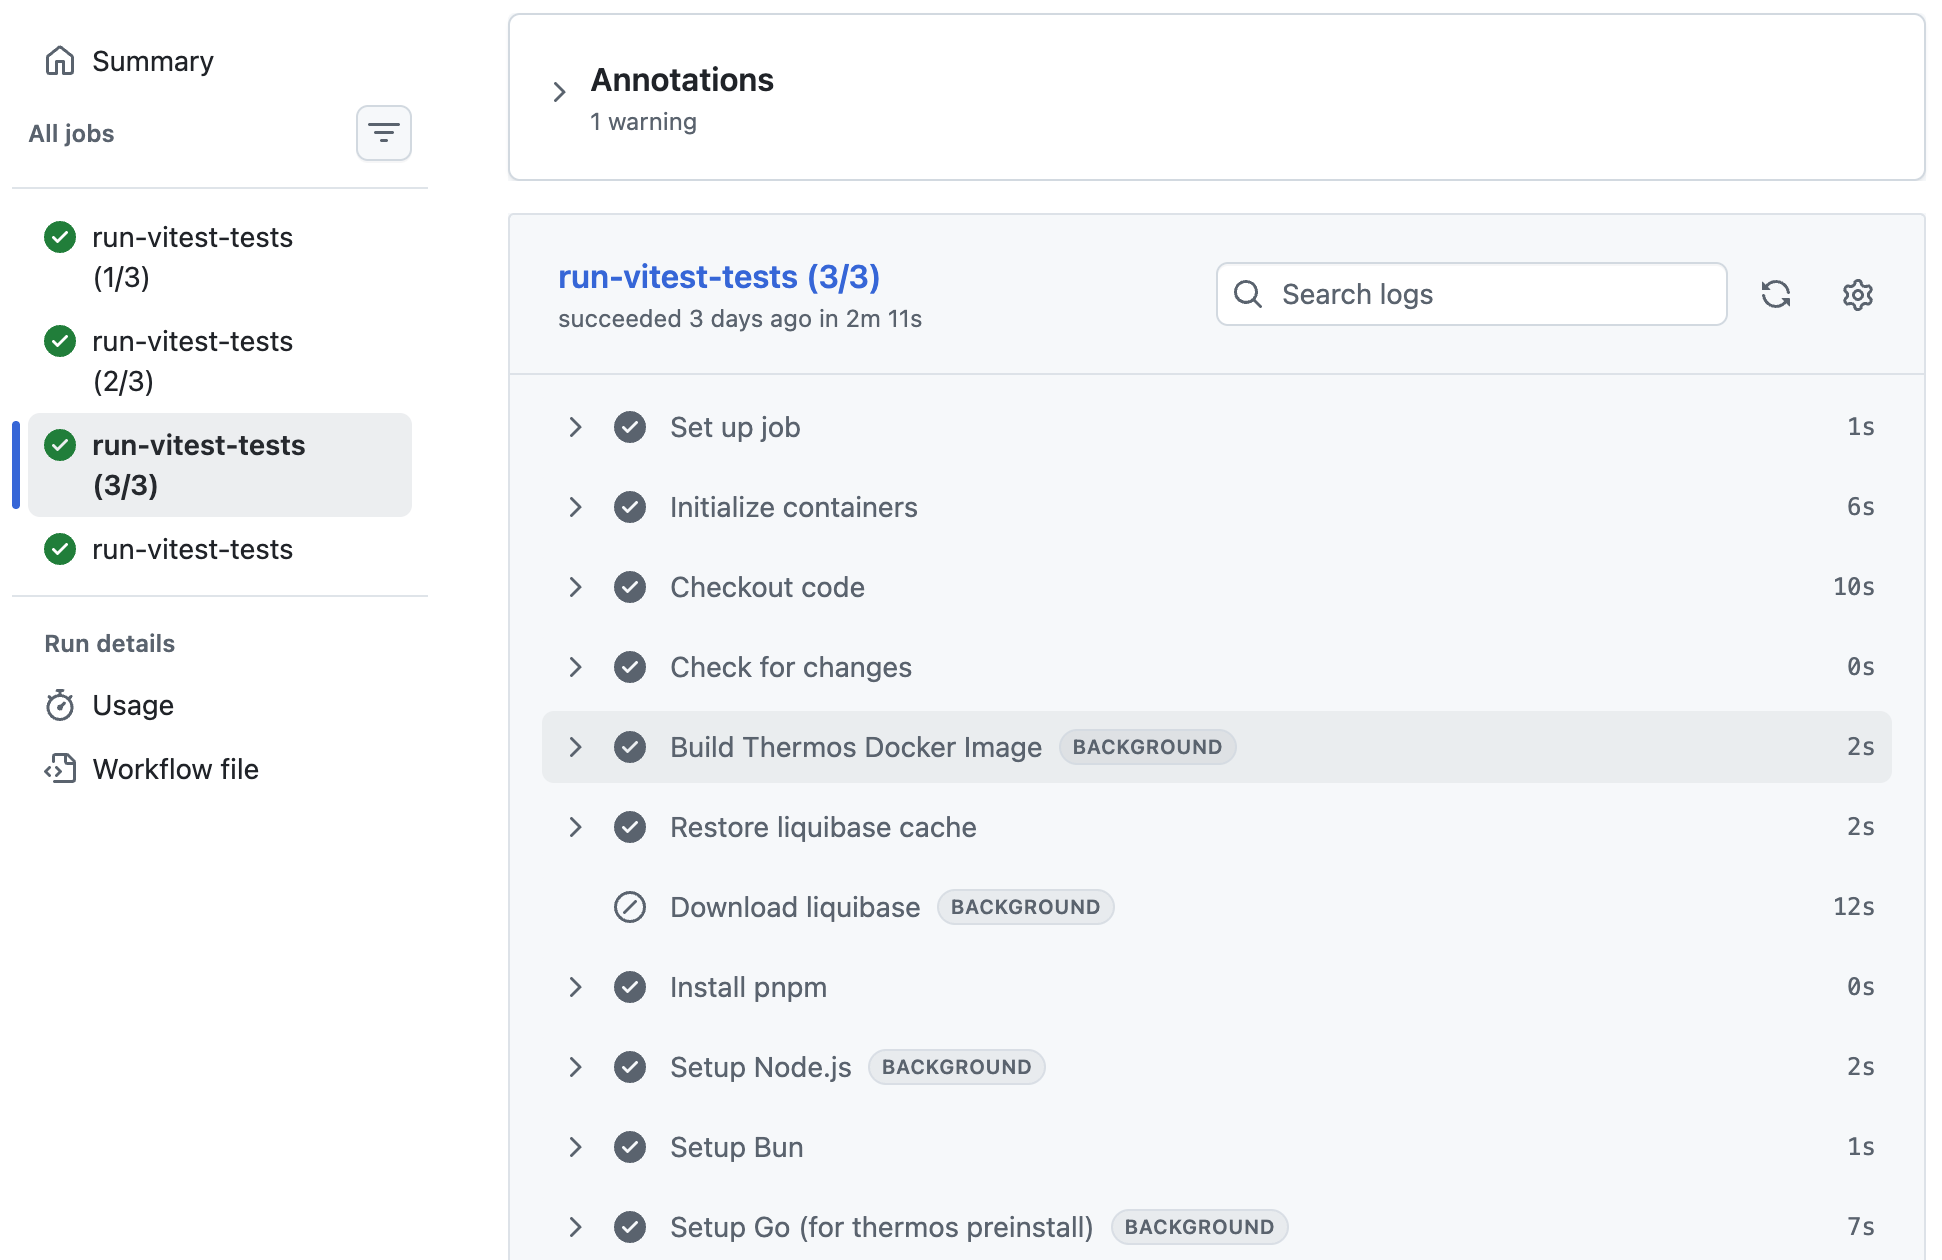
With sharding and overcommit together, the Vitest job went from 6 minutes 29 seconds to three shards that each finish in about two minutes, running side by side. That's roughly the duration of setup alone in some CI pipelines.
Build once and share the artifact
Several test jobs each built Apollo from scratch, which meant doing the same heavy compile once per job.
Abir moved the Apollo build into a shared workflow that runs once at the start. It backgrounds its own setup, restores the Turbo cache, builds Apollo in about 1 minute 27 seconds, and uploads the result as an artifact. The matrix jobs download that artifact in the background as soon as they start, so Apollo is already built by the time a test needs it.
The Thermos image example above follows the same approach: a shared builder produces the image once, and each shard fetches it while its own setup continues.
For a few weeks, Abir kept a Depot tab open and checked each new run for flat stretches in the CPU line.
Get new posts in your inbox
Subscribe for the latest from the Composio blog.
Blog and newsletter updates. Privacy policy.