
How harness, configuration, and connector choices affect agent outcomes across 1,800 trials
We ran a study to see how much an agent's harness, planning setup, and integration gateway affect its ability to finish a task. Each comparison changed one variable at a time, keeping the others fixed, to measure its impact alongside model choice. Across 22 evaluations, we scored roughly 1,800 provider trials. The data also includes 297 measurements across five model comparisons. Together, the tests covered nine harnesses, two models for harness comparisons, three planning setups, three MCP gateways, eleven application-level connector pairings, and five model families.
Key findings
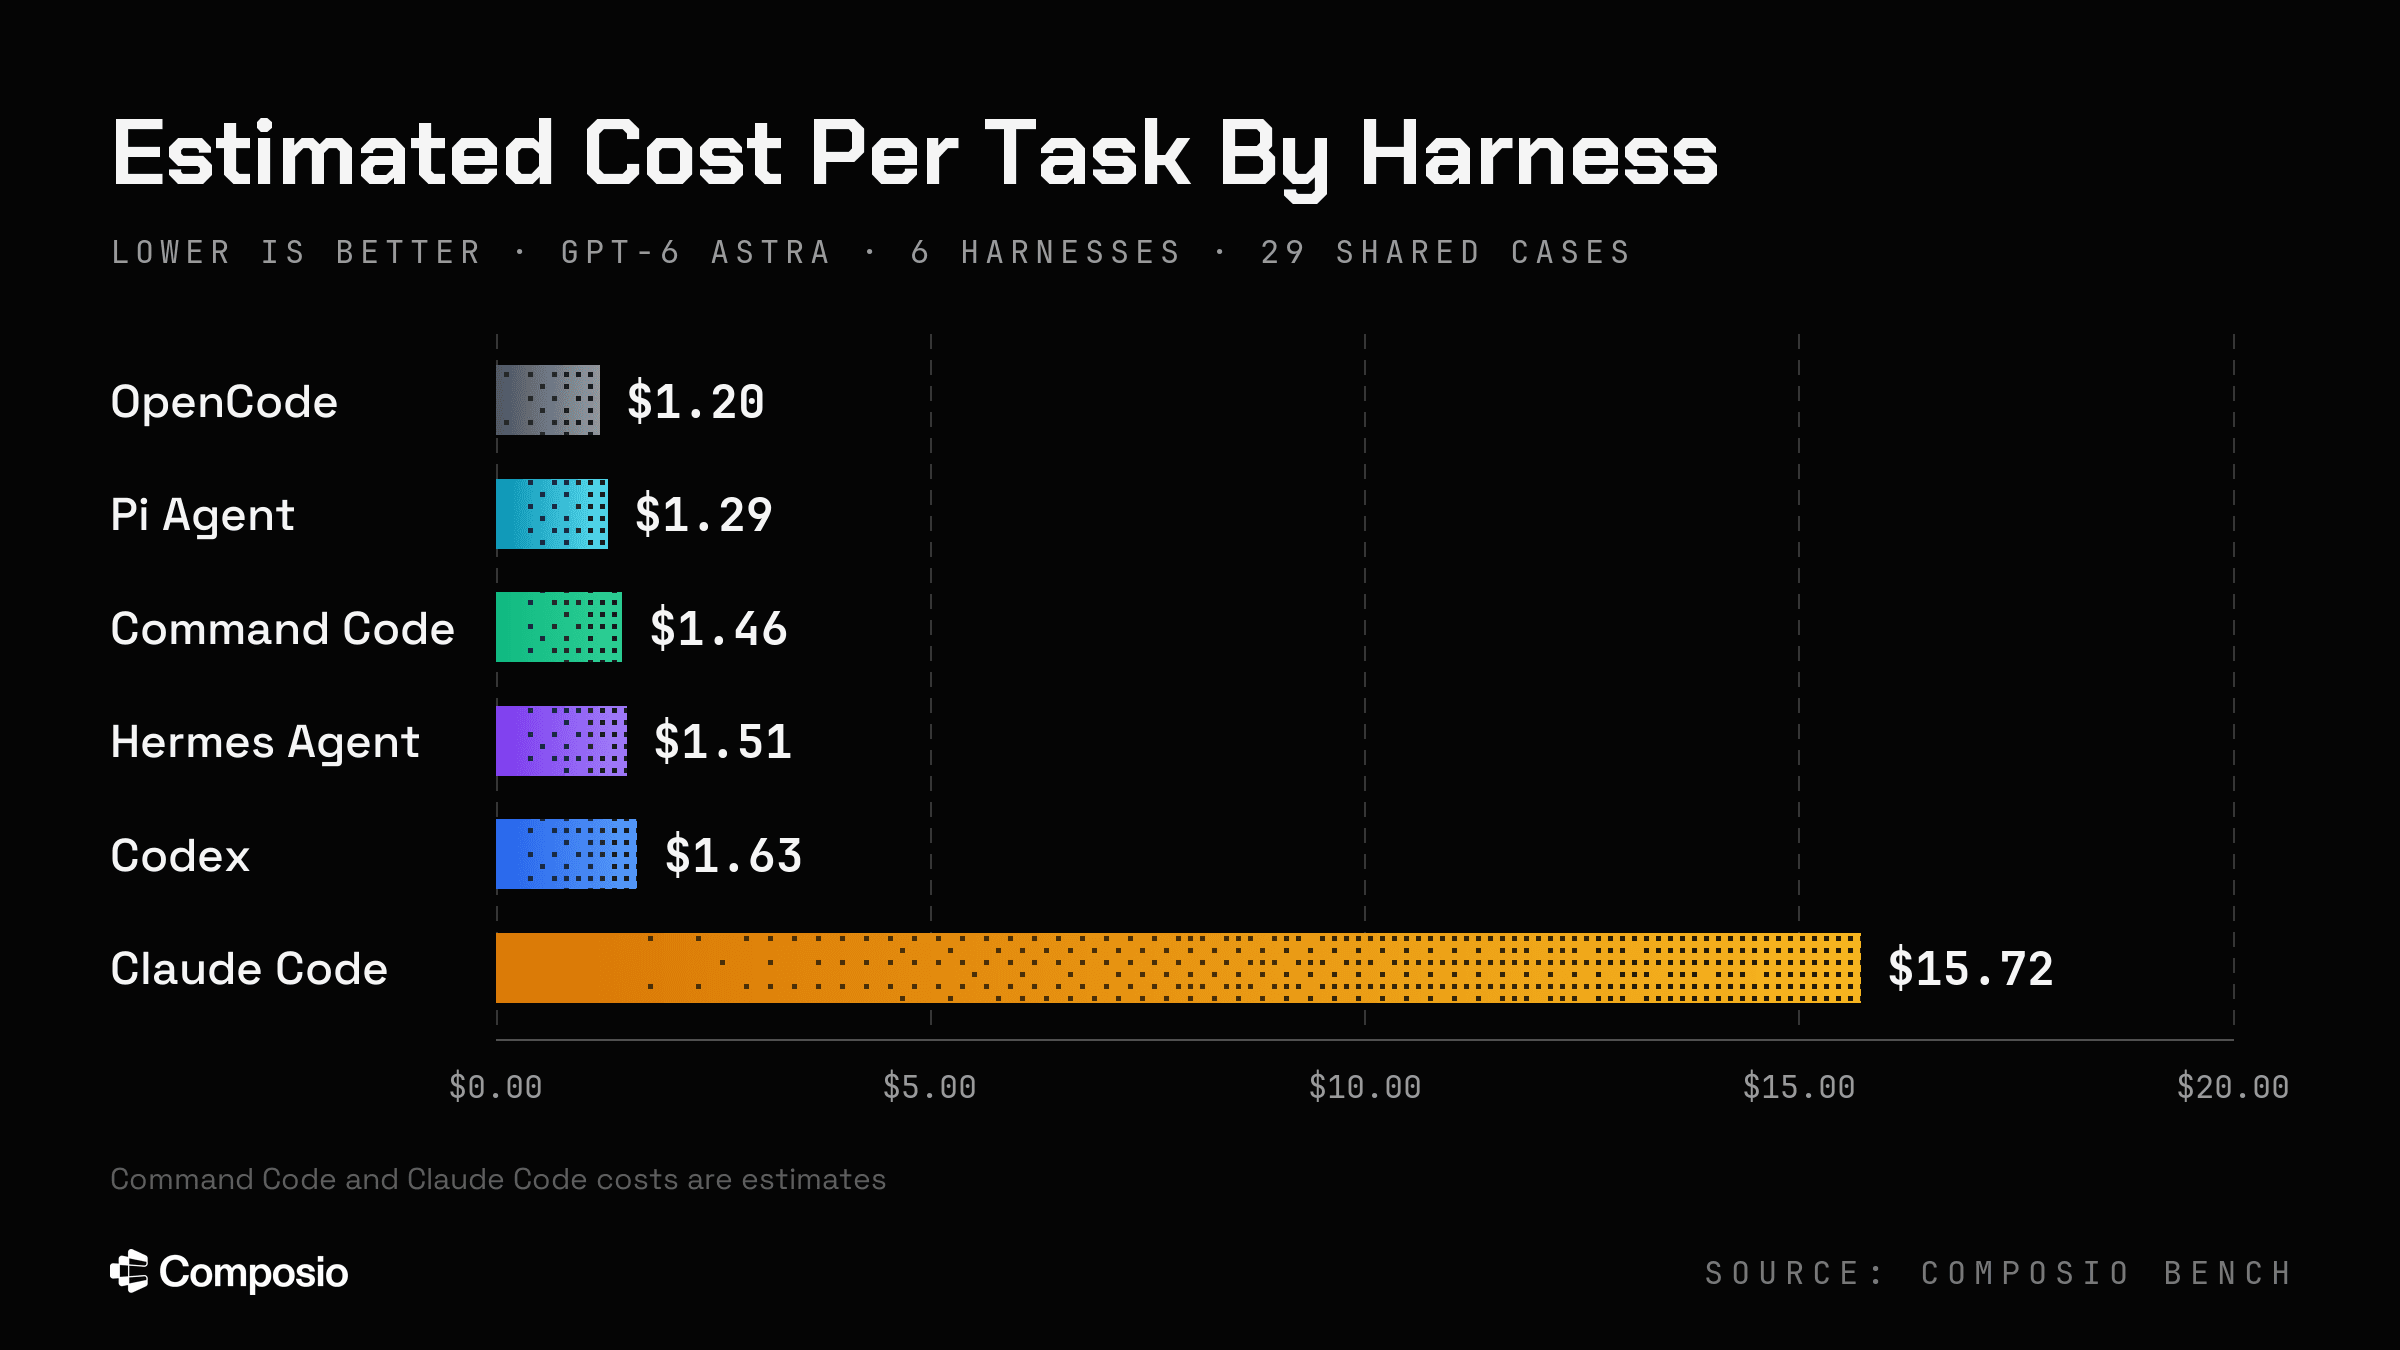
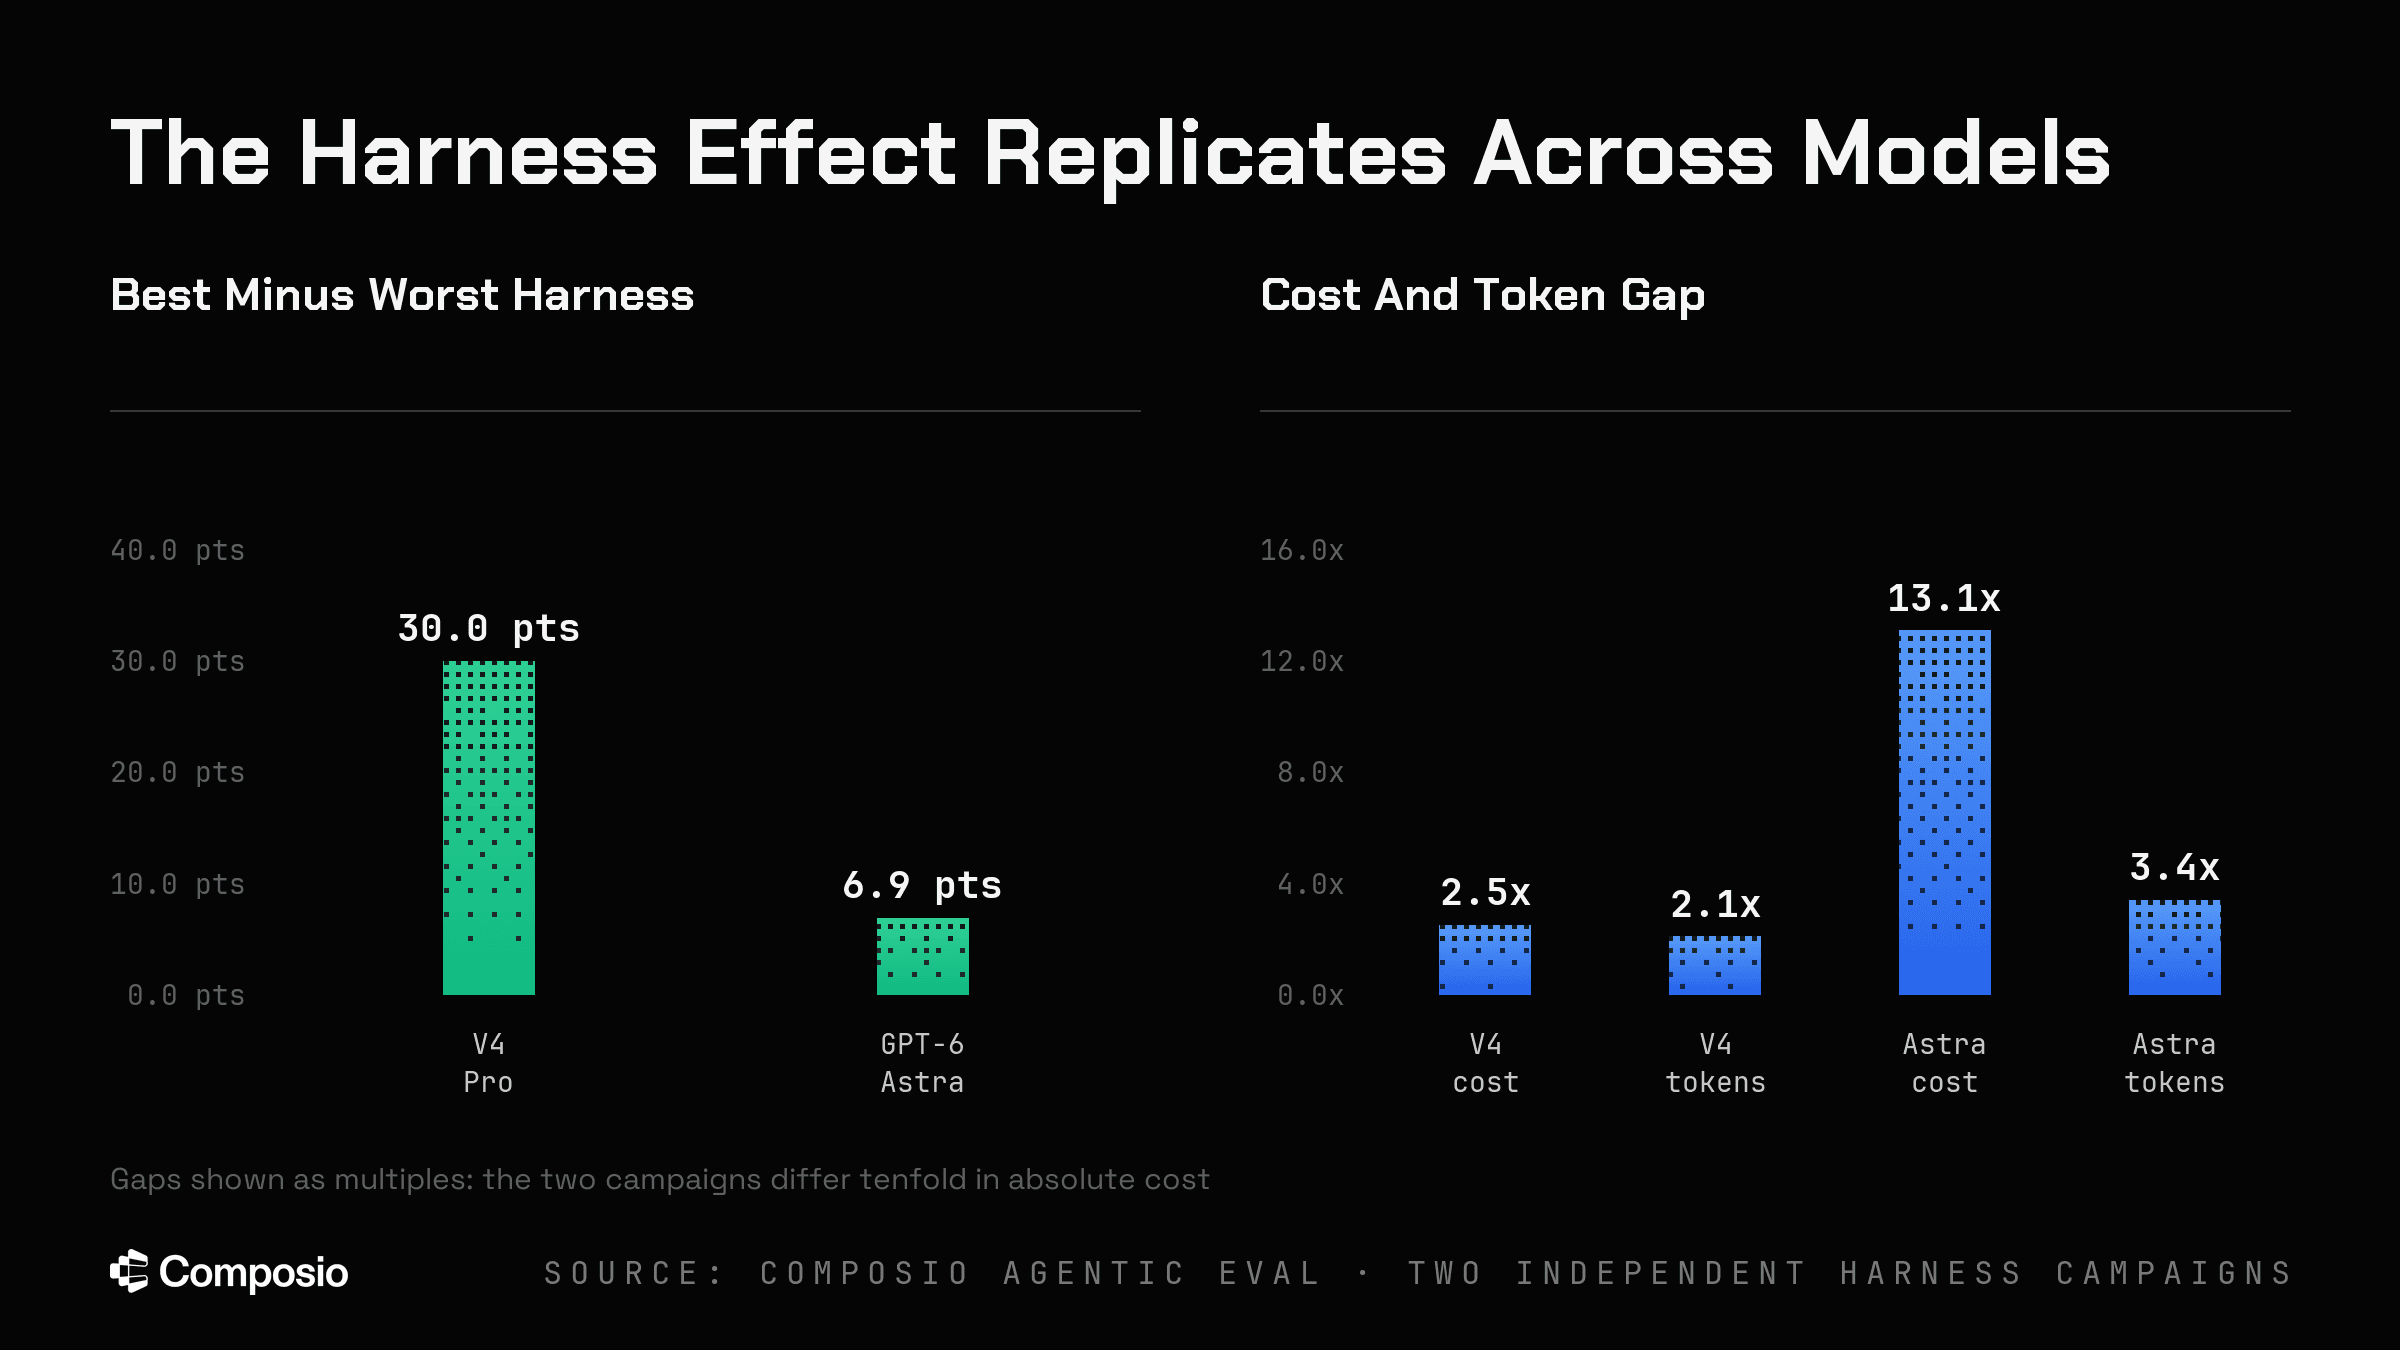
- With the same model, harness choice changed success by 30 percentage points and cost by up to 13.1x: With the model held fixed, success varied by roughly 30 percentage points and cost by 2.5x to 13.1x. On DeepSeek V4 Pro's thirty-task suite, the nine harnesses ranged from 30% to 60% success; cost per task ranged from $0.101 to $0.252. On GPT-6 Astra's twenty-nine shared cases, six harnesses ranged from 66% to 72% success and $1.20 to $15.72 per task. The harness rankings changed between models.
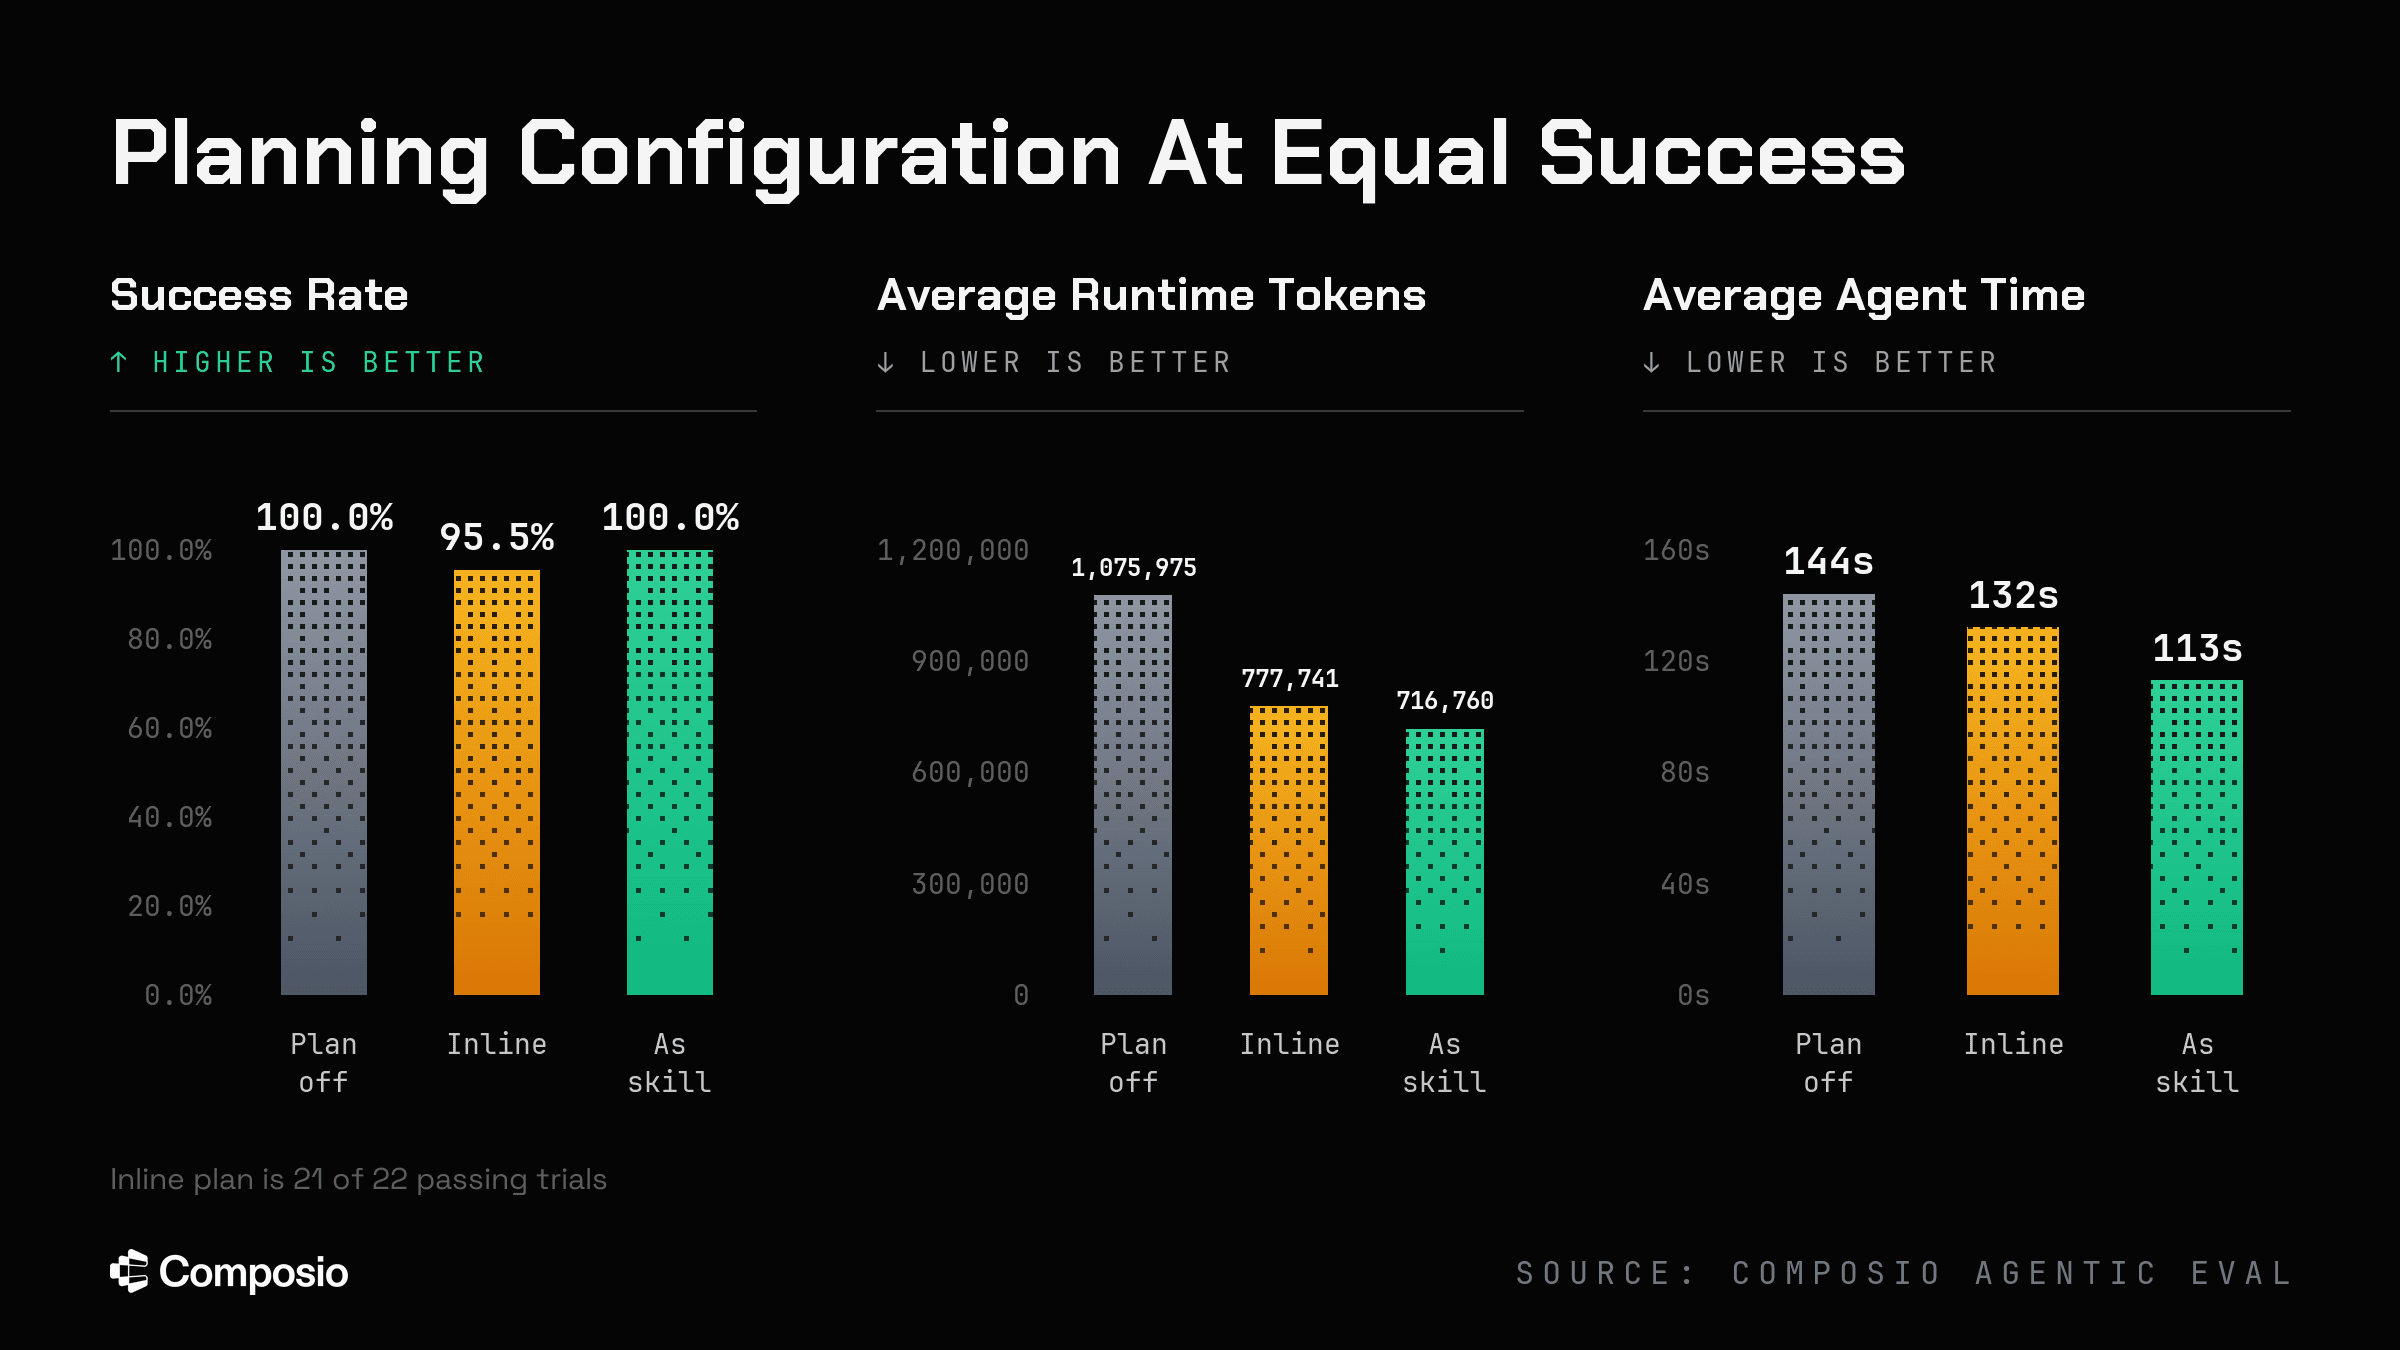
- Skill-based planning used 33.4% fewer tokens at the same 100% success rate: With Sonnet 4.5 and the harness held fixed, skill-based planning matched the no-planning baseline at 100% success while using 33.4% fewer tokens, 21.5% fewer turns, and 21.8% less time. The baseline already passed every case, so this test couldn't measure whether planning helps on harder tasks.
- Composio averaged 99% task completion versus 86% for native connectors, largely through broader tool coverage: Across eleven paired application comparisons, Composio averaged 99% success against 86% for each app's own MCP server, CLI, or first-party connector, a difference of roughly 13 points. Slack had the largest difference (94% vs. 36%): its native server lacked tools to attempt 32 of 50 cases. Native connectors outperformed Composio on success in two comparisons.
- Composio raised success by 2.1 percentage points on average, but one of five models did worse: Across five model families on matched cases, three improved with Composio, one tied, and one declined. The mean paired success increase was +2.1 percentage points. The declining model appears to improve when scored on an unpaired set of cases, so compare the same tasks before choosing a setup.
The tests isolate different decisions in the agent stack. To find what helps your workload, measure the harness, planning setup, and connectors separately, then test them together.
Tooling as an unmeasured variable
What model rankings leave out
When an agent fails a task or costs too much to run, model rankings offer an obvious place to look. But a model score alone doesn't tell you which part of your setup caused the problem.
The harness runs the agent loop: it sends requests to the model, manages conversation history, calls tools, handles retries, and decides when to stop. Planning instructions guide what the agent does inside that loop. The integration gateway determines which tools it can reach and how results come back.
The May 2026 study Harness-Bench shows why execution deserves this attention: 24.6% of failed runs included tool errors or blocked commands without effective recovery, and 11.1% failed to save required outputs. These categories can overlap. Both expose steps where an agent can lose progress between receiving a task and delivering its result.
Our study asks how much changing that execution setup affects task completion and cost. We hold the model fixed while testing the harness, planning setup, and connectors separately. That gives teams evidence for deciding whether to change how the agent runs, how it plans, or which tools it can use when tasks fail or become too expensive.
How harness choice affects success and cost
Study design: Controlling for model
In each evaluation, we kept the model, task suite, and hosted Composio MCP tool catalog fixed while testing different harnesses. Each setup is an experimental arm. This lets us compare how harnesses manage context, load tool schemas, handle retries, and stop execution.
Repeating the comparison with two models helps test whether a harness's ranking carries over when the model changes.
How scoring works: Coverage measures whether the agent reached the correct tool. Success measures whether the task passed the end-to-end verifier. Quality measures the share of individual verification checks passed, so a failed task can still earn partial credit on quality.
DeepSeek V4 Pro, nine harnesses, thirty-task suite
All nine harnesses ran the same 30 tasks with the same scoring rules (270 trials). Across the evaluation, 136 of 270 provider trials passed.
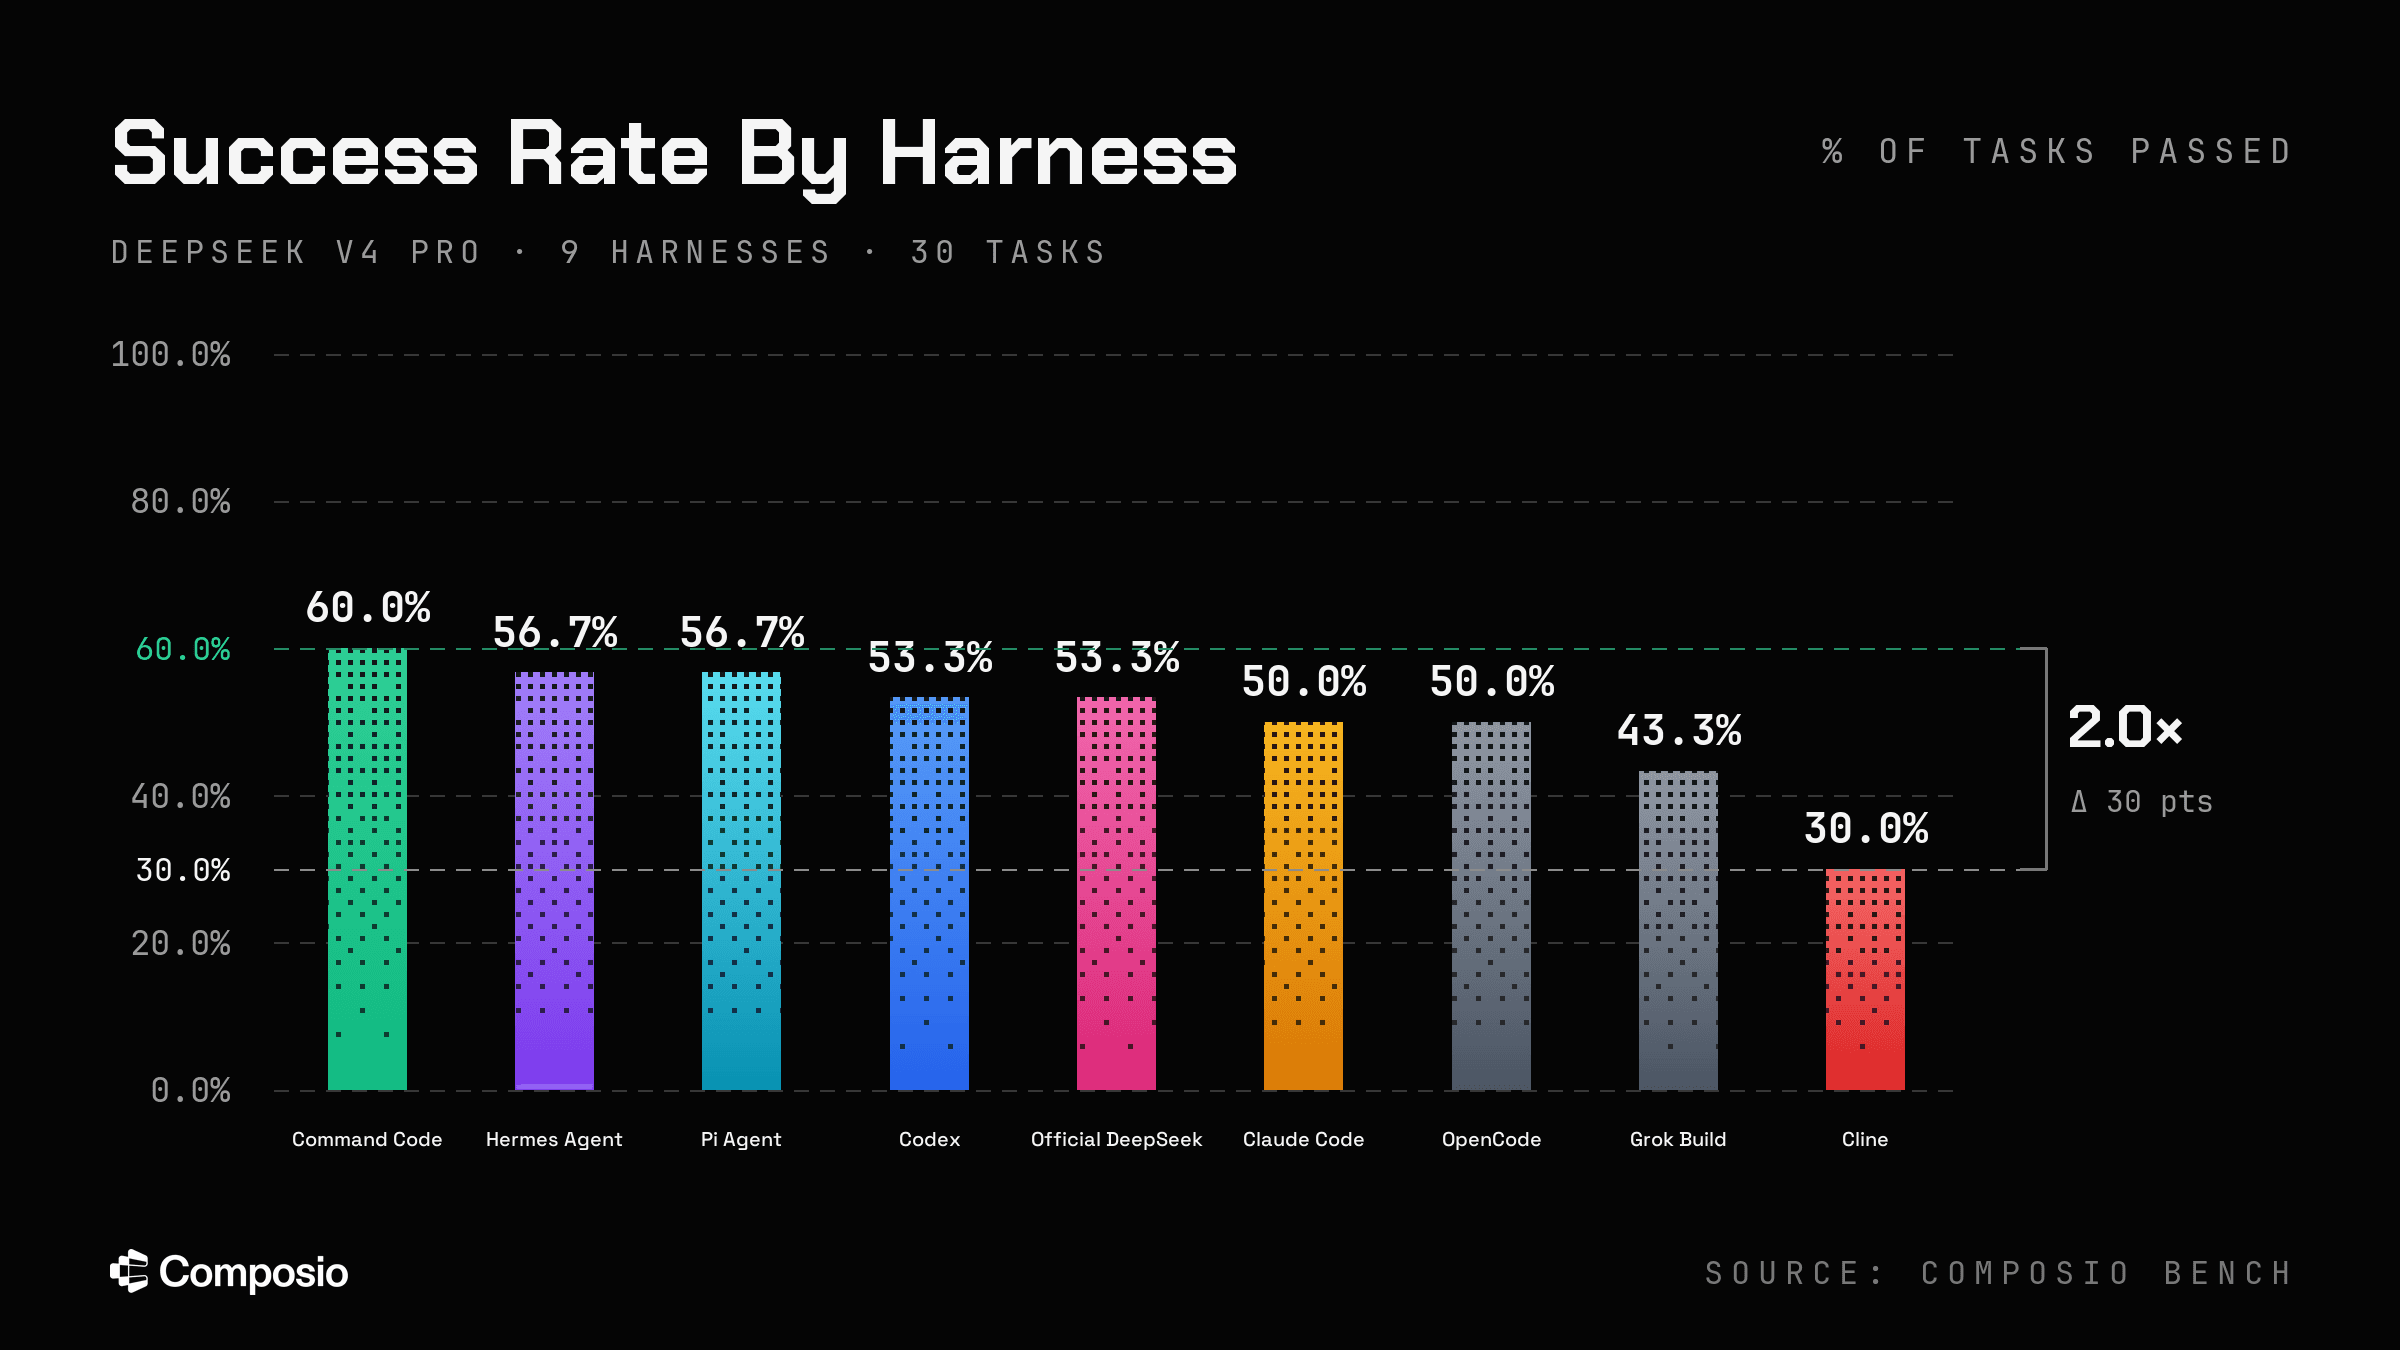
Running the same DeepSeek model through different agent harnesses changed task success from 30% to 60%.
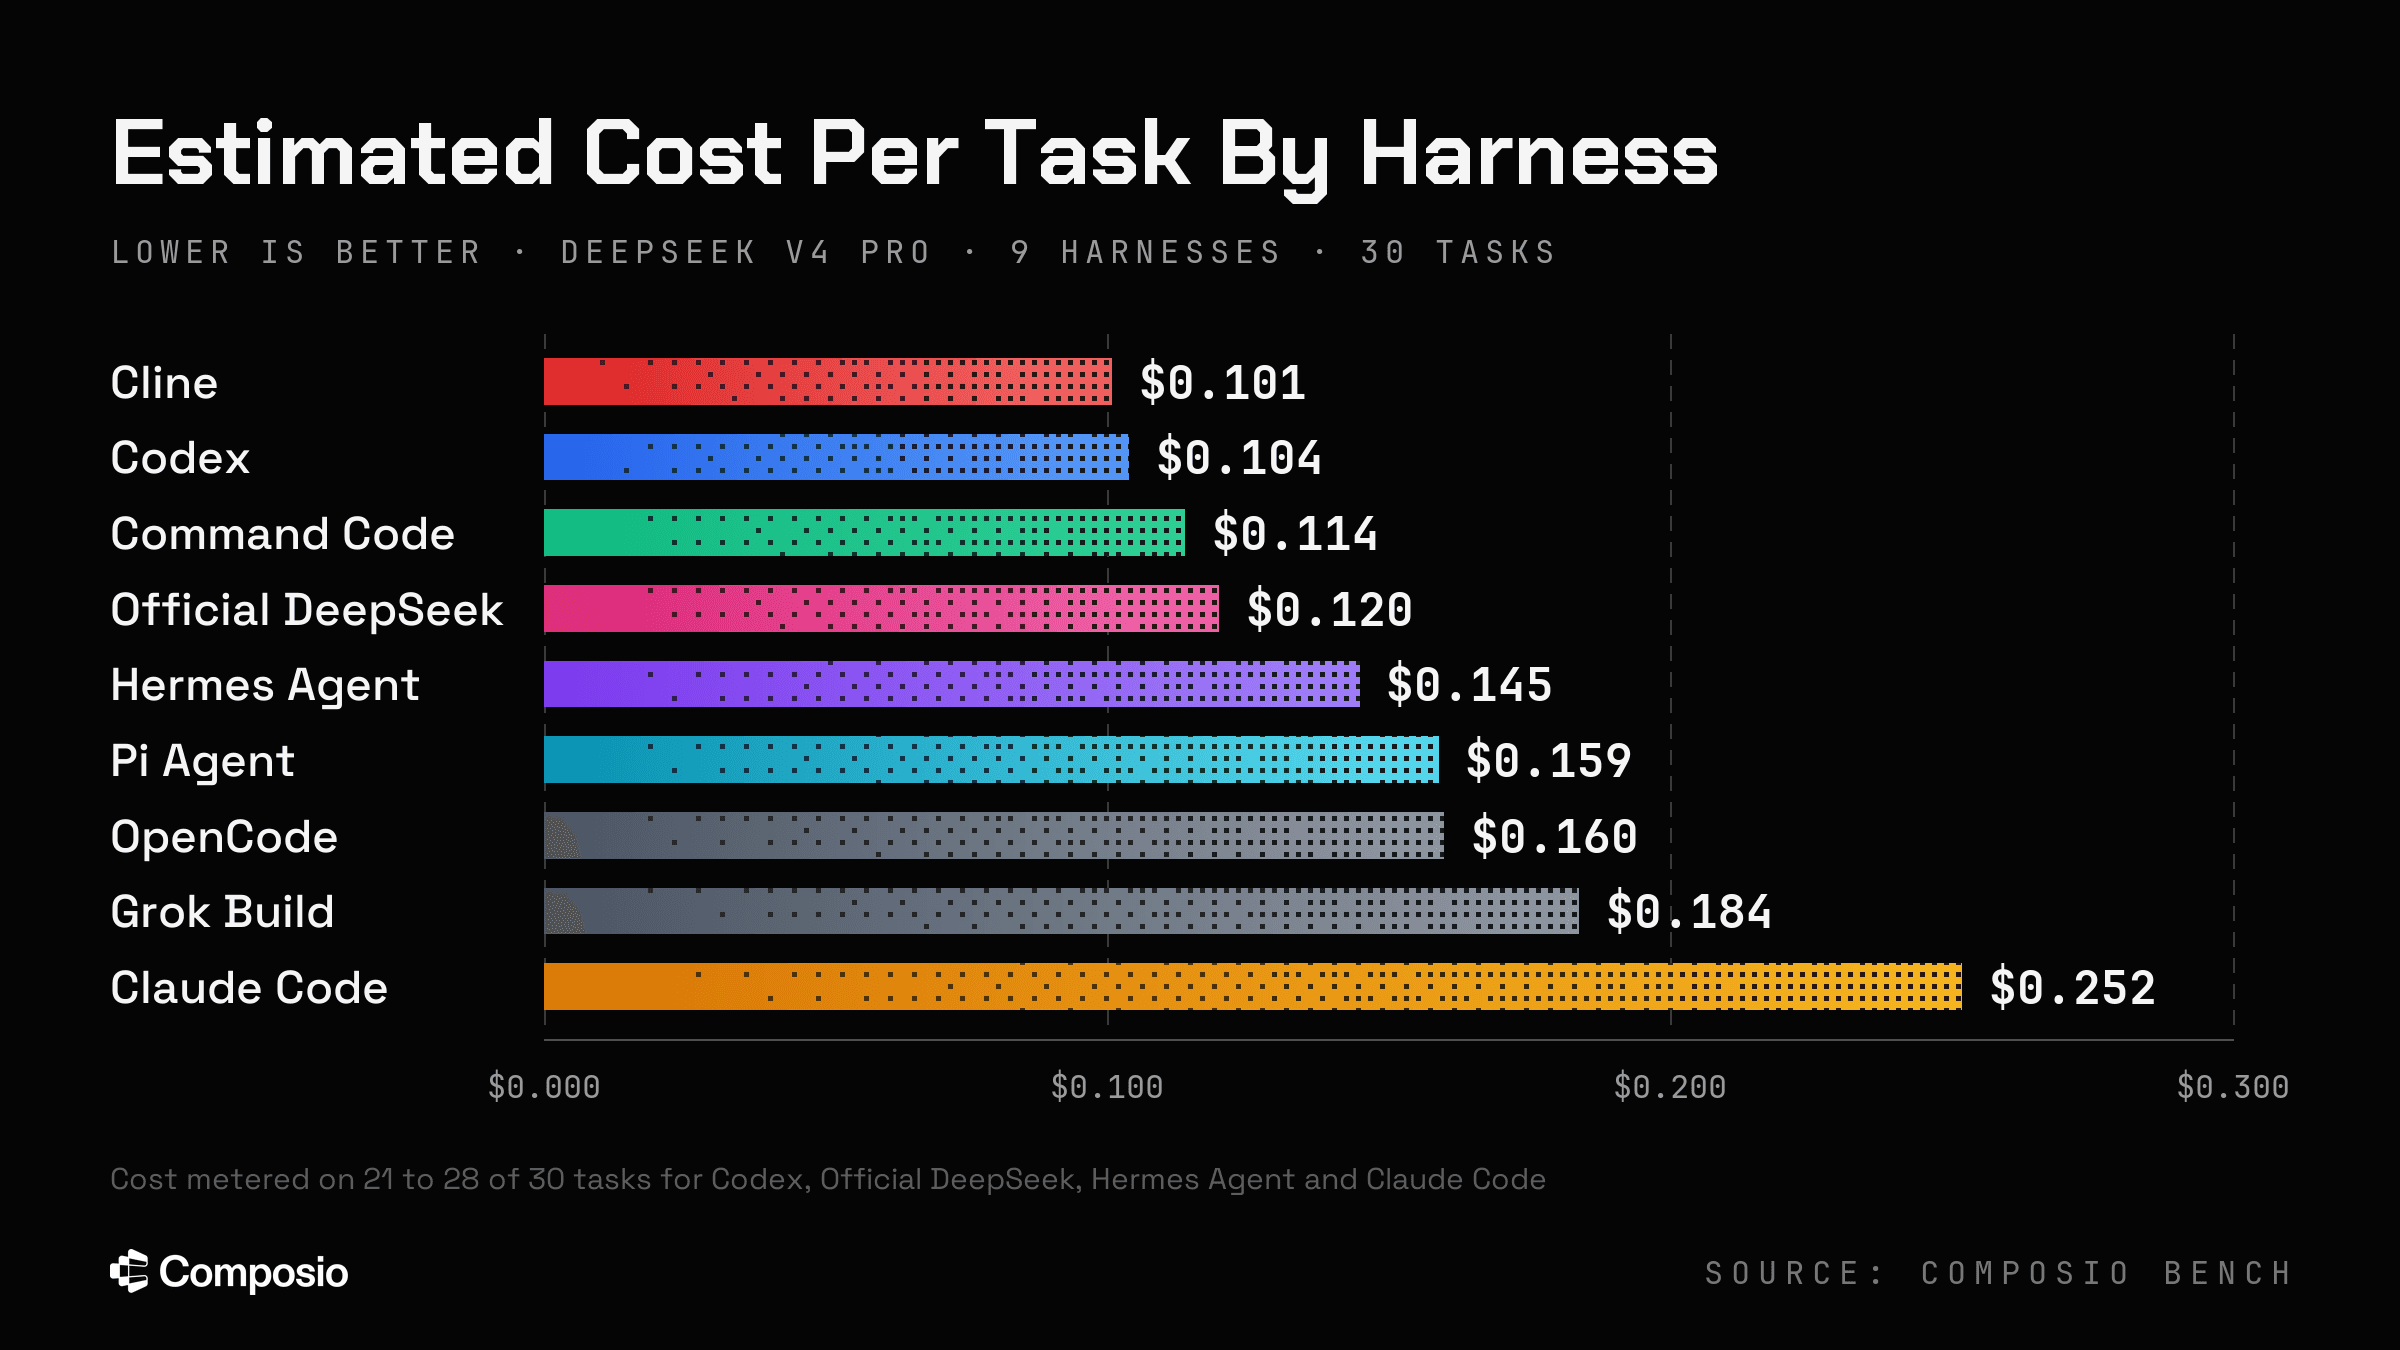
Token use per task ranged 2.1x, from 596,623 to 1,233,872. Codex sits at the low end, but its usage was recorded on only 21 of 30 tasks, so its average covers fewer tasks than the others. Across the five harnesses with usage recorded on all 30 tasks, the spread narrows to 1.3x.
- Cost coverage: Cost was recorded on every task for five harnesses. For Codex (21 of 30 tasks), Claude Code (25), Hermes Agent (26) and the official DeepSeek harness (28), the per-task averages cover only the recorded tasks.
GPT-6 Astra, six harnesses, twenty-nine shared cases
The second evaluation used GPT-6 Astra with hosted Composio MCP. All six harnesses ran the same 29 valid cases with the same scoring rules (174 trials). One case from the 30-task suite was excluded from every arm. Across the evaluation, 121 of 174 trials passed.
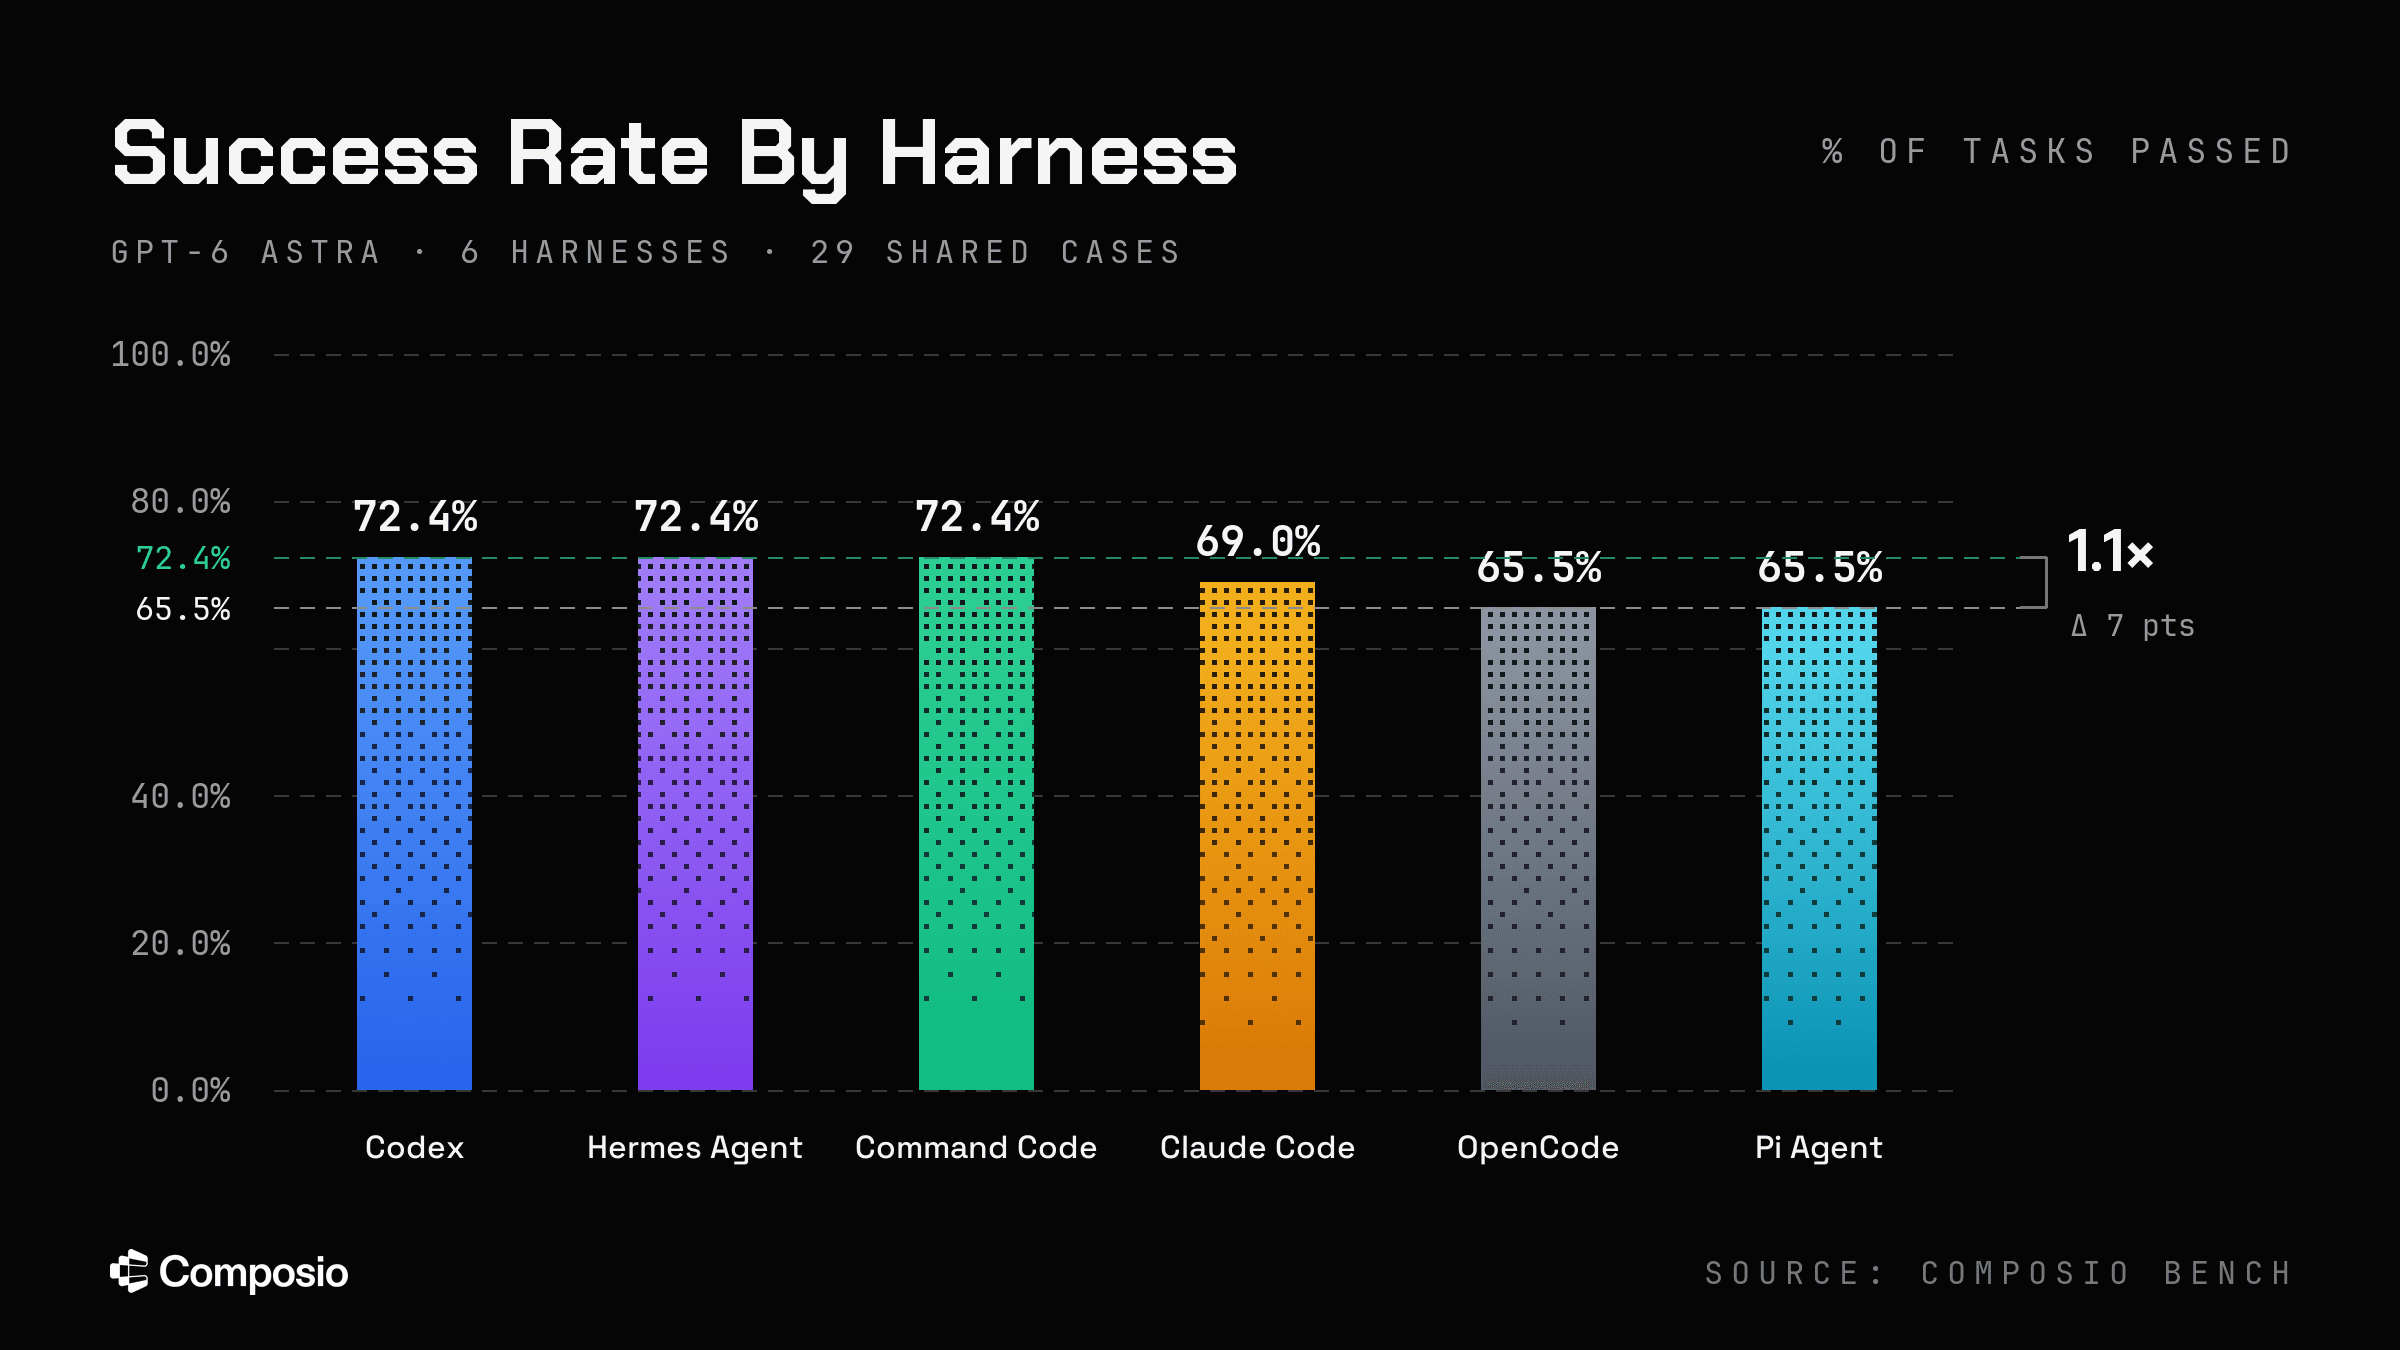
Success ranges 7 percentage points, 66% to 72%, a much narrower spread than the 30 points on DeepSeek V4 Pro over the same task suite.
The Claude Code cost outlier: Cost per task ranges 13.1x across the six arms, but the distribution is not smooth. Five of six arms fall within a 1.4x band, from $1.20 to $1.63. Claude Code sits at $15.72, 9.6x the next most expensive arm, while placing fourth on success.
Claude Code also used the most tokens per task (1,547k) and took the longest per task (194s).
Token accounting: The token slice covers the 29 cases for which every harness has comparable usage records. Tokens are defined as uncached input plus cache reads plus cache writes plus generated output, with separately reported reasoning added exactly once. Cached tokens count at face value, so this measures token throughput rather than dollar cost, and the cost chart above is the appropriate cost comparison. OpenCode is the most token-efficient arm at 450k per case against 1,547k for Claude Code, a 3.4x spread.
How the harness rankings changed between models
The evaluations tested nine and six harnesses with a fixed model and found success spreads of 30 and 7 percentage points. Cost varied by 2.5x on DeepSeek and 13.1x on GPT-6 Astra. Token use varied by 2.1x across all nine arms on DeepSeek and 3.4x on GPT-6 Astra. Harness choice affected reliability and resource use on both models.
The six harnesses tested in both evaluations finished in different orders.
| Harness | DeepSeek V4 Pro | Rank | GPT-6 Astra | Rank |
|---|---|---|---|---|
| Command Code | 60.0% | 1 | 72.4% | 2 |
| Hermes Agent | 56.7% | 2.5 | 72.4% | 2 |
| Pi Agent | 56.7% | 2.5 | 65.5% | 5.5 |
| Codex | 53.3% | 4 | 72.4% | 2 |
| Claude Code | 50.0% | 5.5 | 69.0% | 4 |
| OpenCode | 50.0% | 5.5 | 65.5% | 5.5 |
Pi Agent placed joint second on DeepSeek V4 Pro but joint fifth on GPT-6 Astra, so harness rankings don't reliably carry over between models.
Test candidate harnesses on the model you use. These two evaluations showed 30 and 7 points of success between the highest and lowest scores, and a ranking from one only partly predicted the other.
There are two limits to this comparison. Both evaluations used the same 30-task suite, but GPT-6 Astra was scored on 29 of those cases and the two models differ in overall capability, so the comparison is of rankings within each evaluation rather than of absolute rates across evaluations. With six paired harnesses, a rank correlation of 0.48 is not statistically distinguishable from zero in either direction. This sample is too small to establish whether the rankings are related.
An August 2026 study, The Scaffolding Matters More Than the Interface, compared seven agent setups and five models on one repository workflow. It found large cost differences between setups and inconsistent MCP-to-CLI cost ratios. Its single-task scope is another reason to test costs on the workflows you intend to run.
Methodology notes
- Cost estimation basis: Costs come from the Composio bench. On GPT-6 Astra, the Command Code and Claude Code costs are estimates. These figures are not vendor invoices.
How planning changes token use
Study design: Isolating configuration from model and harness
We tested three planning setups with Sonnet 4.5, keeping the harness and integration layer fixed. Eleven cases ran twice per arm for 66 provider trials, with judge-assisted verification. Only the planning instructions changed:
- Plan off: No planning instruction. The agent receives the task and acts.
- Inline plan: A planning instruction embedded directly in the prompt.
- Plan as skill: Planning supplied as a loadable skill the agent invokes.
Ten of eleven scenarios passed on all three arms; 65 of 66 trials passed.
Results
Why fewer turns use fewer tokens
Giving the agent its planning instructions as a skill cut token use by 33.4% with no drop in success.
The no-planning baseline already passed 100% of this eleven-case suite. That leaves room to measure efficiency gains, but it can't tell us whether planning would help an agent complete harder tasks. Skill-based planning kept the baseline success rate; inline planning lost one case.
The token savings closely tracked the reduction in turns and provider calls. Each model request reads the conversation so far, including tool results and schemas. Even when that history is cached, reading it still consumes tokens. Finishing in fewer turns avoids repeatedly processing that growing history.
Test planning instructions alongside harness choice. The harness controls the loop; planning instructions guide the agent's actions within it.
Comparing MCP gateways
Study design: Gateway-level comparisons
An MCP gateway gives an agent access to actions across multiple apps. We compared gateways while keeping the model and harness fixed.
These were separate experiments with different task suites. The workflow-automation comparison covered 104 paired cases per arm; the alternative-gateway comparison covered 37. Compare results within each experiment.
Gateway comparison I: Workflow-automation gateway
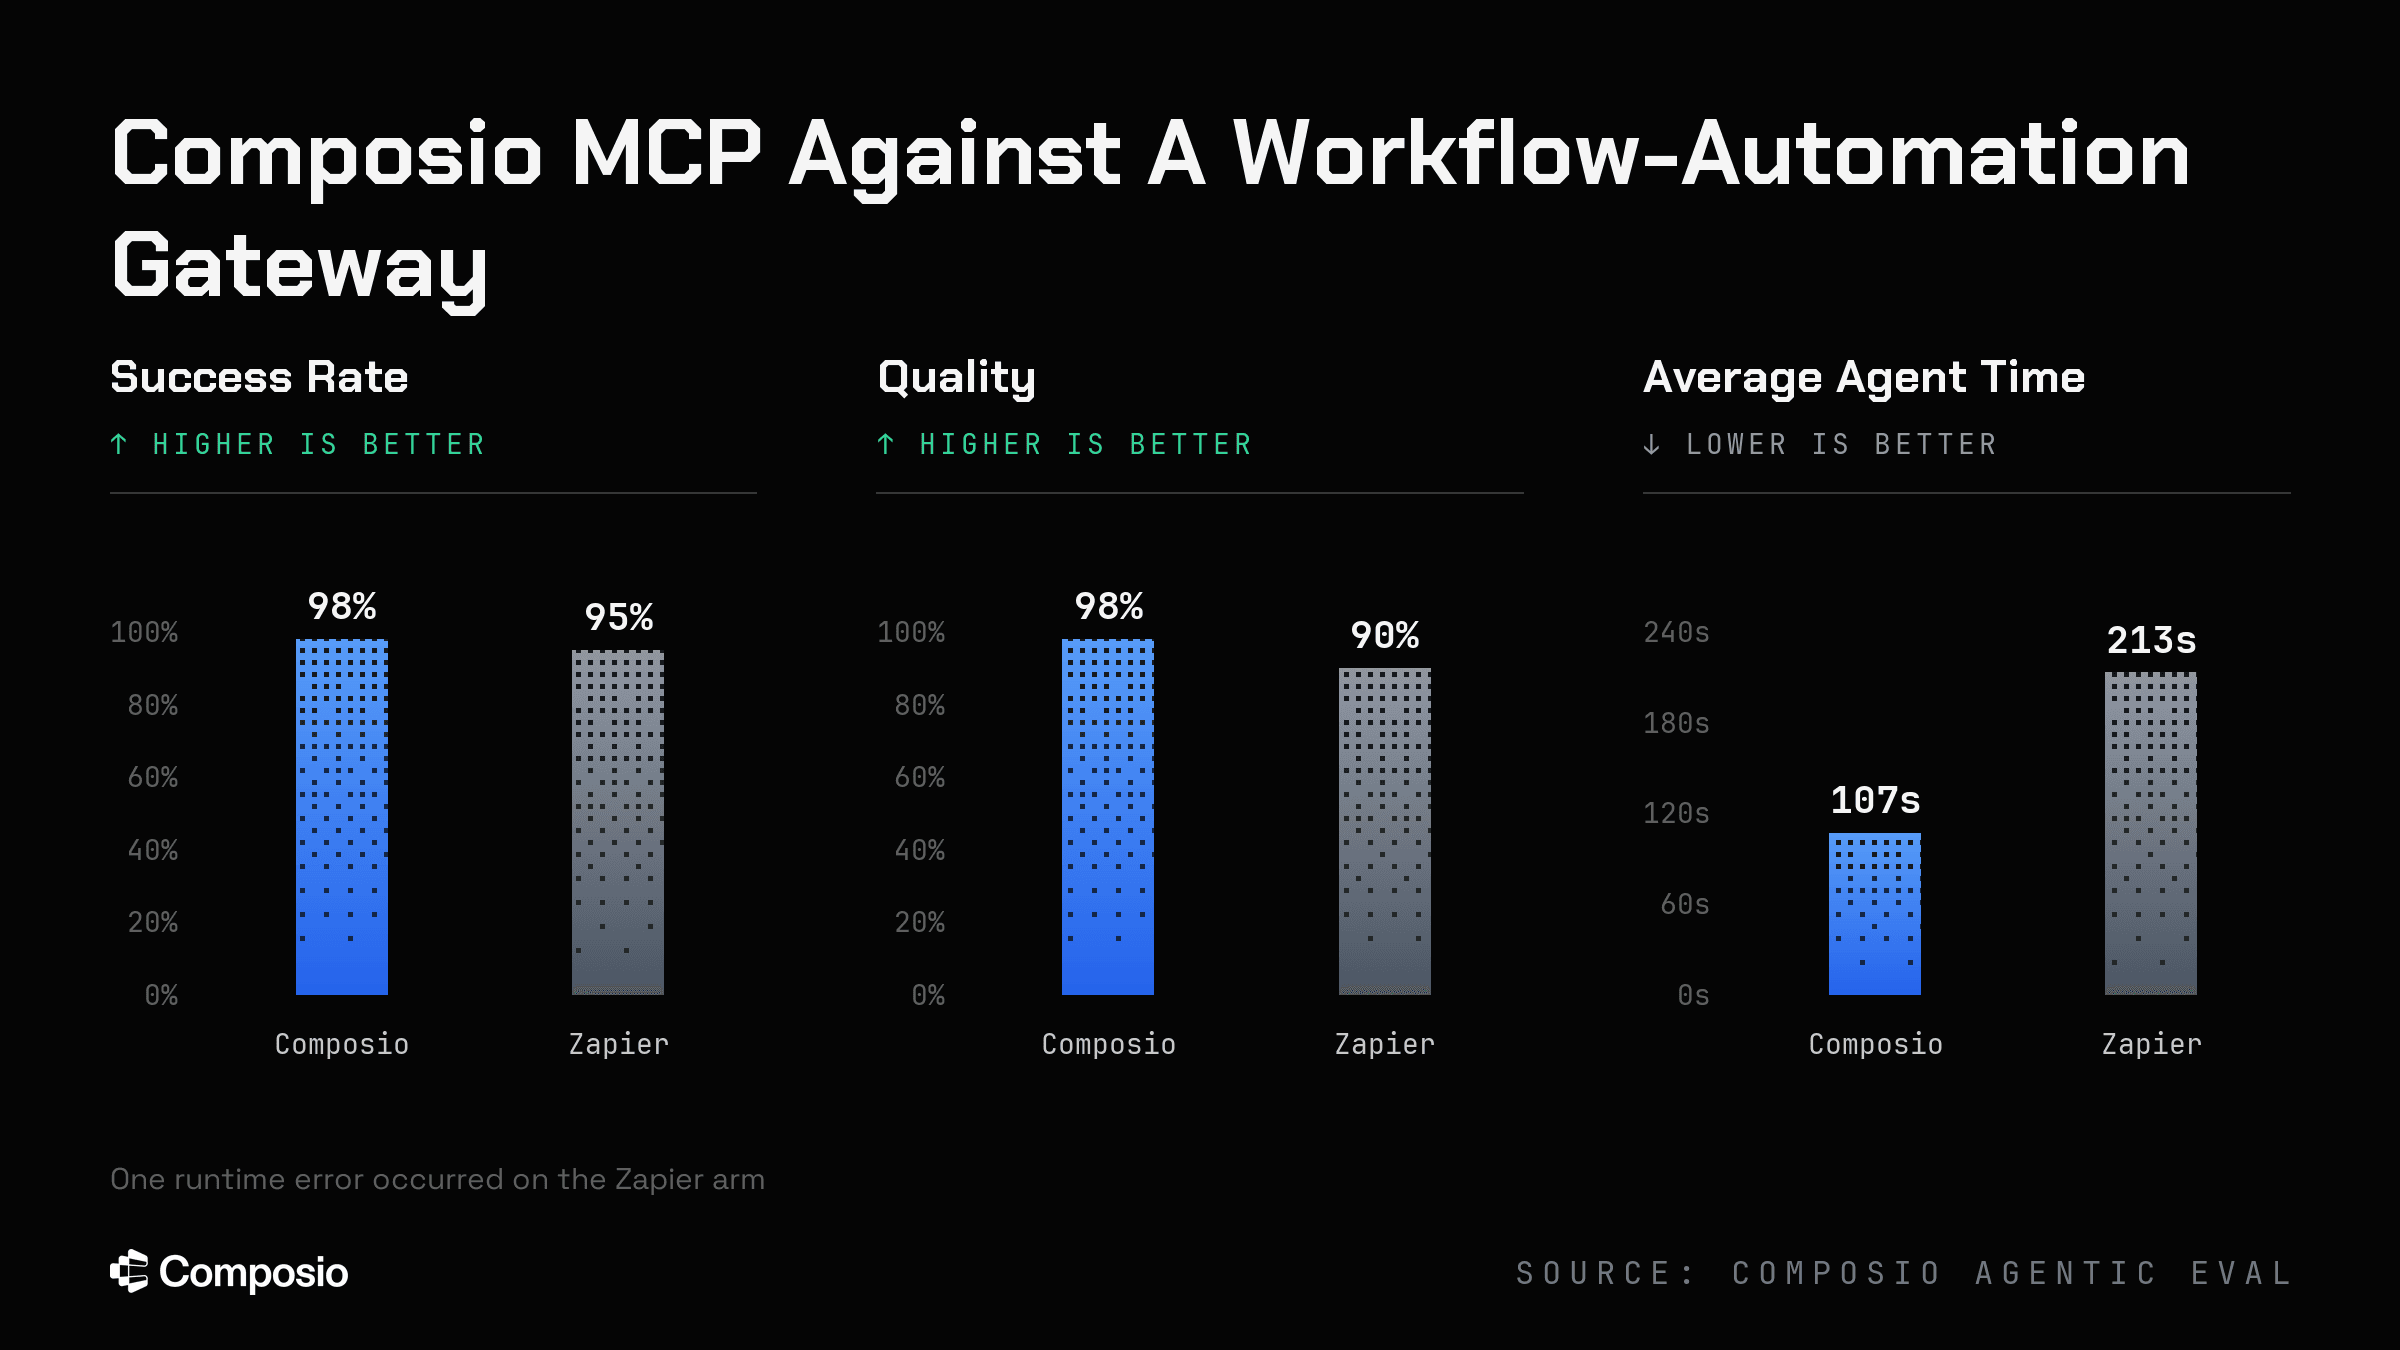
Both arms reached the correct tools on every case, giving each 100% coverage. The success difference is 3 points, and the quality difference is 8 points. The wider quality gap indicates that the workflow-automation arm's failures were partial-credit failures, passing some verification checks and failing others, rather than outright non-attempts.
The efficiency difference is larger than the outcome difference. The Composio arm used 41% fewer turns, 52% fewer provider calls and 50% less wall-clock time, at 18% fewer runtime tokens. The turn and call reductions are much larger than the token reduction, which is the cached-prefix effect again: later turns are dominated by re-reading accumulated history, so halving the turn count does not halve the token count.
In short, against Zapier's MCP gateway, Composio finished tasks in half the time (107s vs. 213s) with 41% fewer turns.
Gateway comparison II: Alternative gateway under two loading configurations
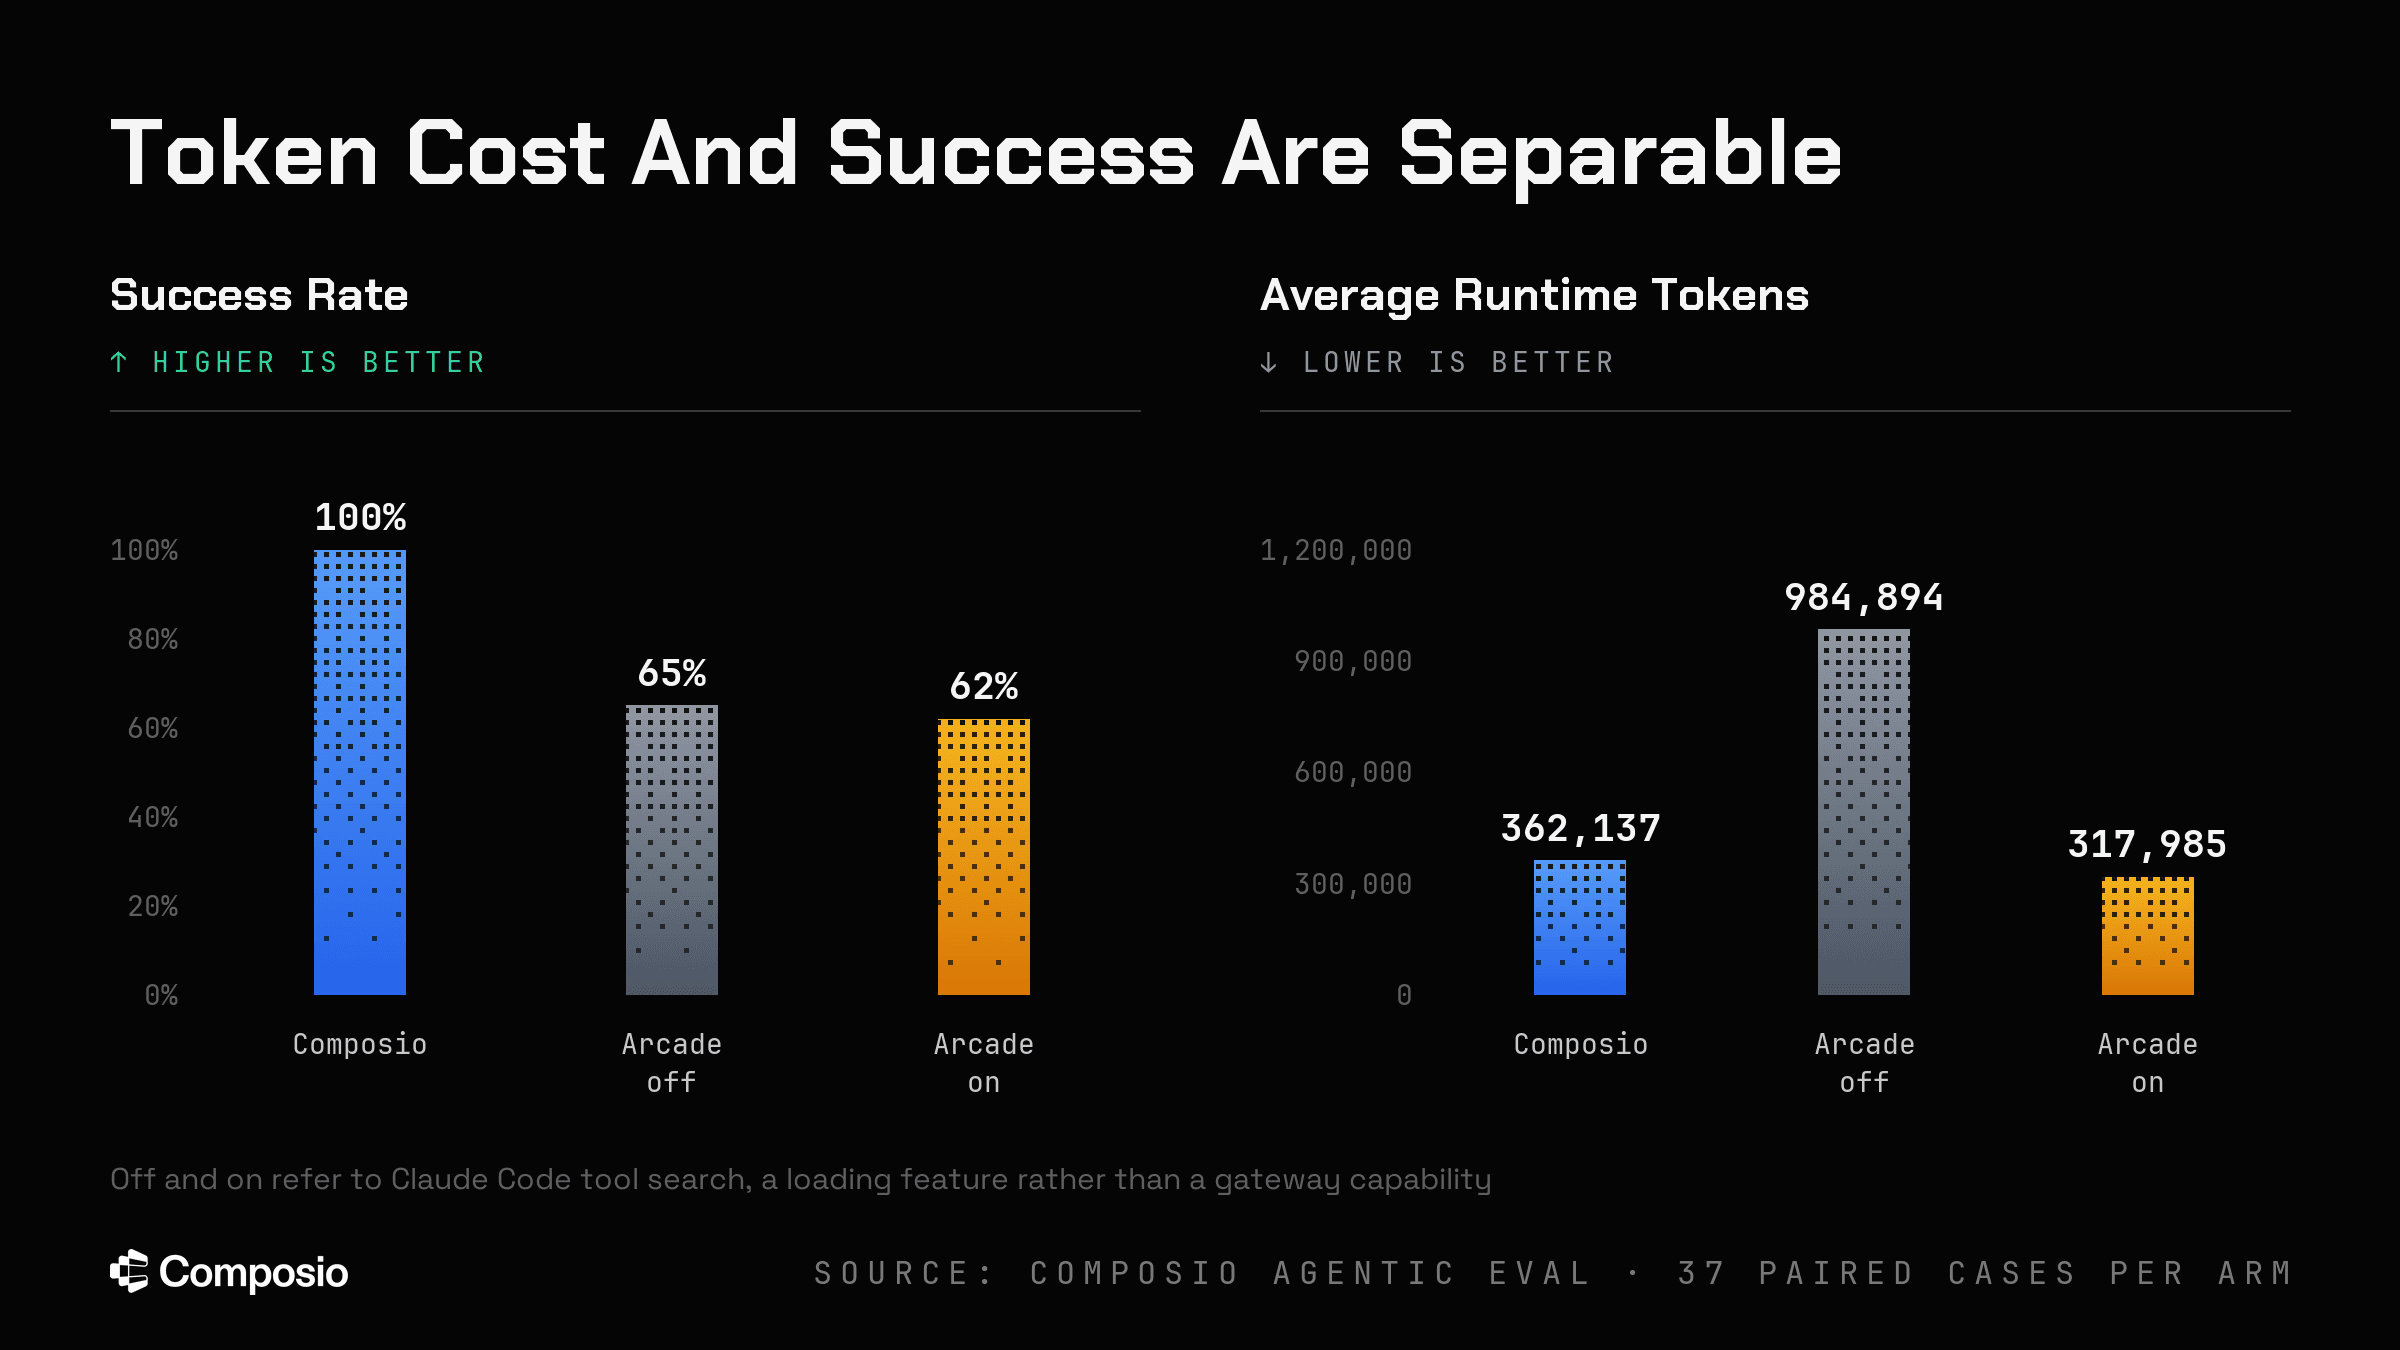
Deferred schema loading cut Arcade's token use by 68% but didn't raise its success rate, while Composio completed all 37 tasks.
Limitations of the gateway comparisons
The two comparisons use different task suites and case counts. The aggregate "99% versus 74%" figure averages three separate experiments, so it should not be read as a single matched comparison of all three setups.
The 65% and 62% Arcade success rates are observed results. They do not establish that changing the loading configuration caused the difference in success.
Comparing native connectors
Study design: Eleven application-level integrations
This section compares the integration layer against each application's own official access path: its first-party MCP server, its vendor CLI, or its first-party assistant connector. Model and harness are held fixed and each comparison is paired case-by-case within an application.
Tool availability and tool selection need separate checks. MCP-Atlas, revised in May 2026, evaluates how agents select and combine tools across real MCP servers. In our connector comparisons, we also distinguish tasks a connector can attempt from tasks it completes correctly.
| Application | Comparison partner | Cases / arm | Matched slice |
|---|---|---|---|
| Airtable | Airtable's own MCP server | 27 | unavailable |
| Datadog | Datadog's own MCP server | 35 | 22 |
| GitHub | GitHub's own MCP server | 43 | 40 |
| LaunchDarkly | LaunchDarkly's own MCP server | 20 | 20 |
| Slack | Slack's own MCP server | 50 | 18 mutually runnable |
| Gmail | Google Workspace CLI | 45 | 45 |
| Google Drive | Google Workspace CLI | 51 | 50 adjudicated |
| Google Sheets | Google Workspace CLI | 37 | 37 |
| Google Calendar | Google Workspace CLI | 47 | 47 |
| Google Drive | Claude AI connector | 51 | 50 |
| Google Calendar | Claude AI connector | 47 | 47 |
Eleven paired comparisons across nine applications. Google Drive and Google Calendar each appear twice, measured against two different partners.
Aggregate results
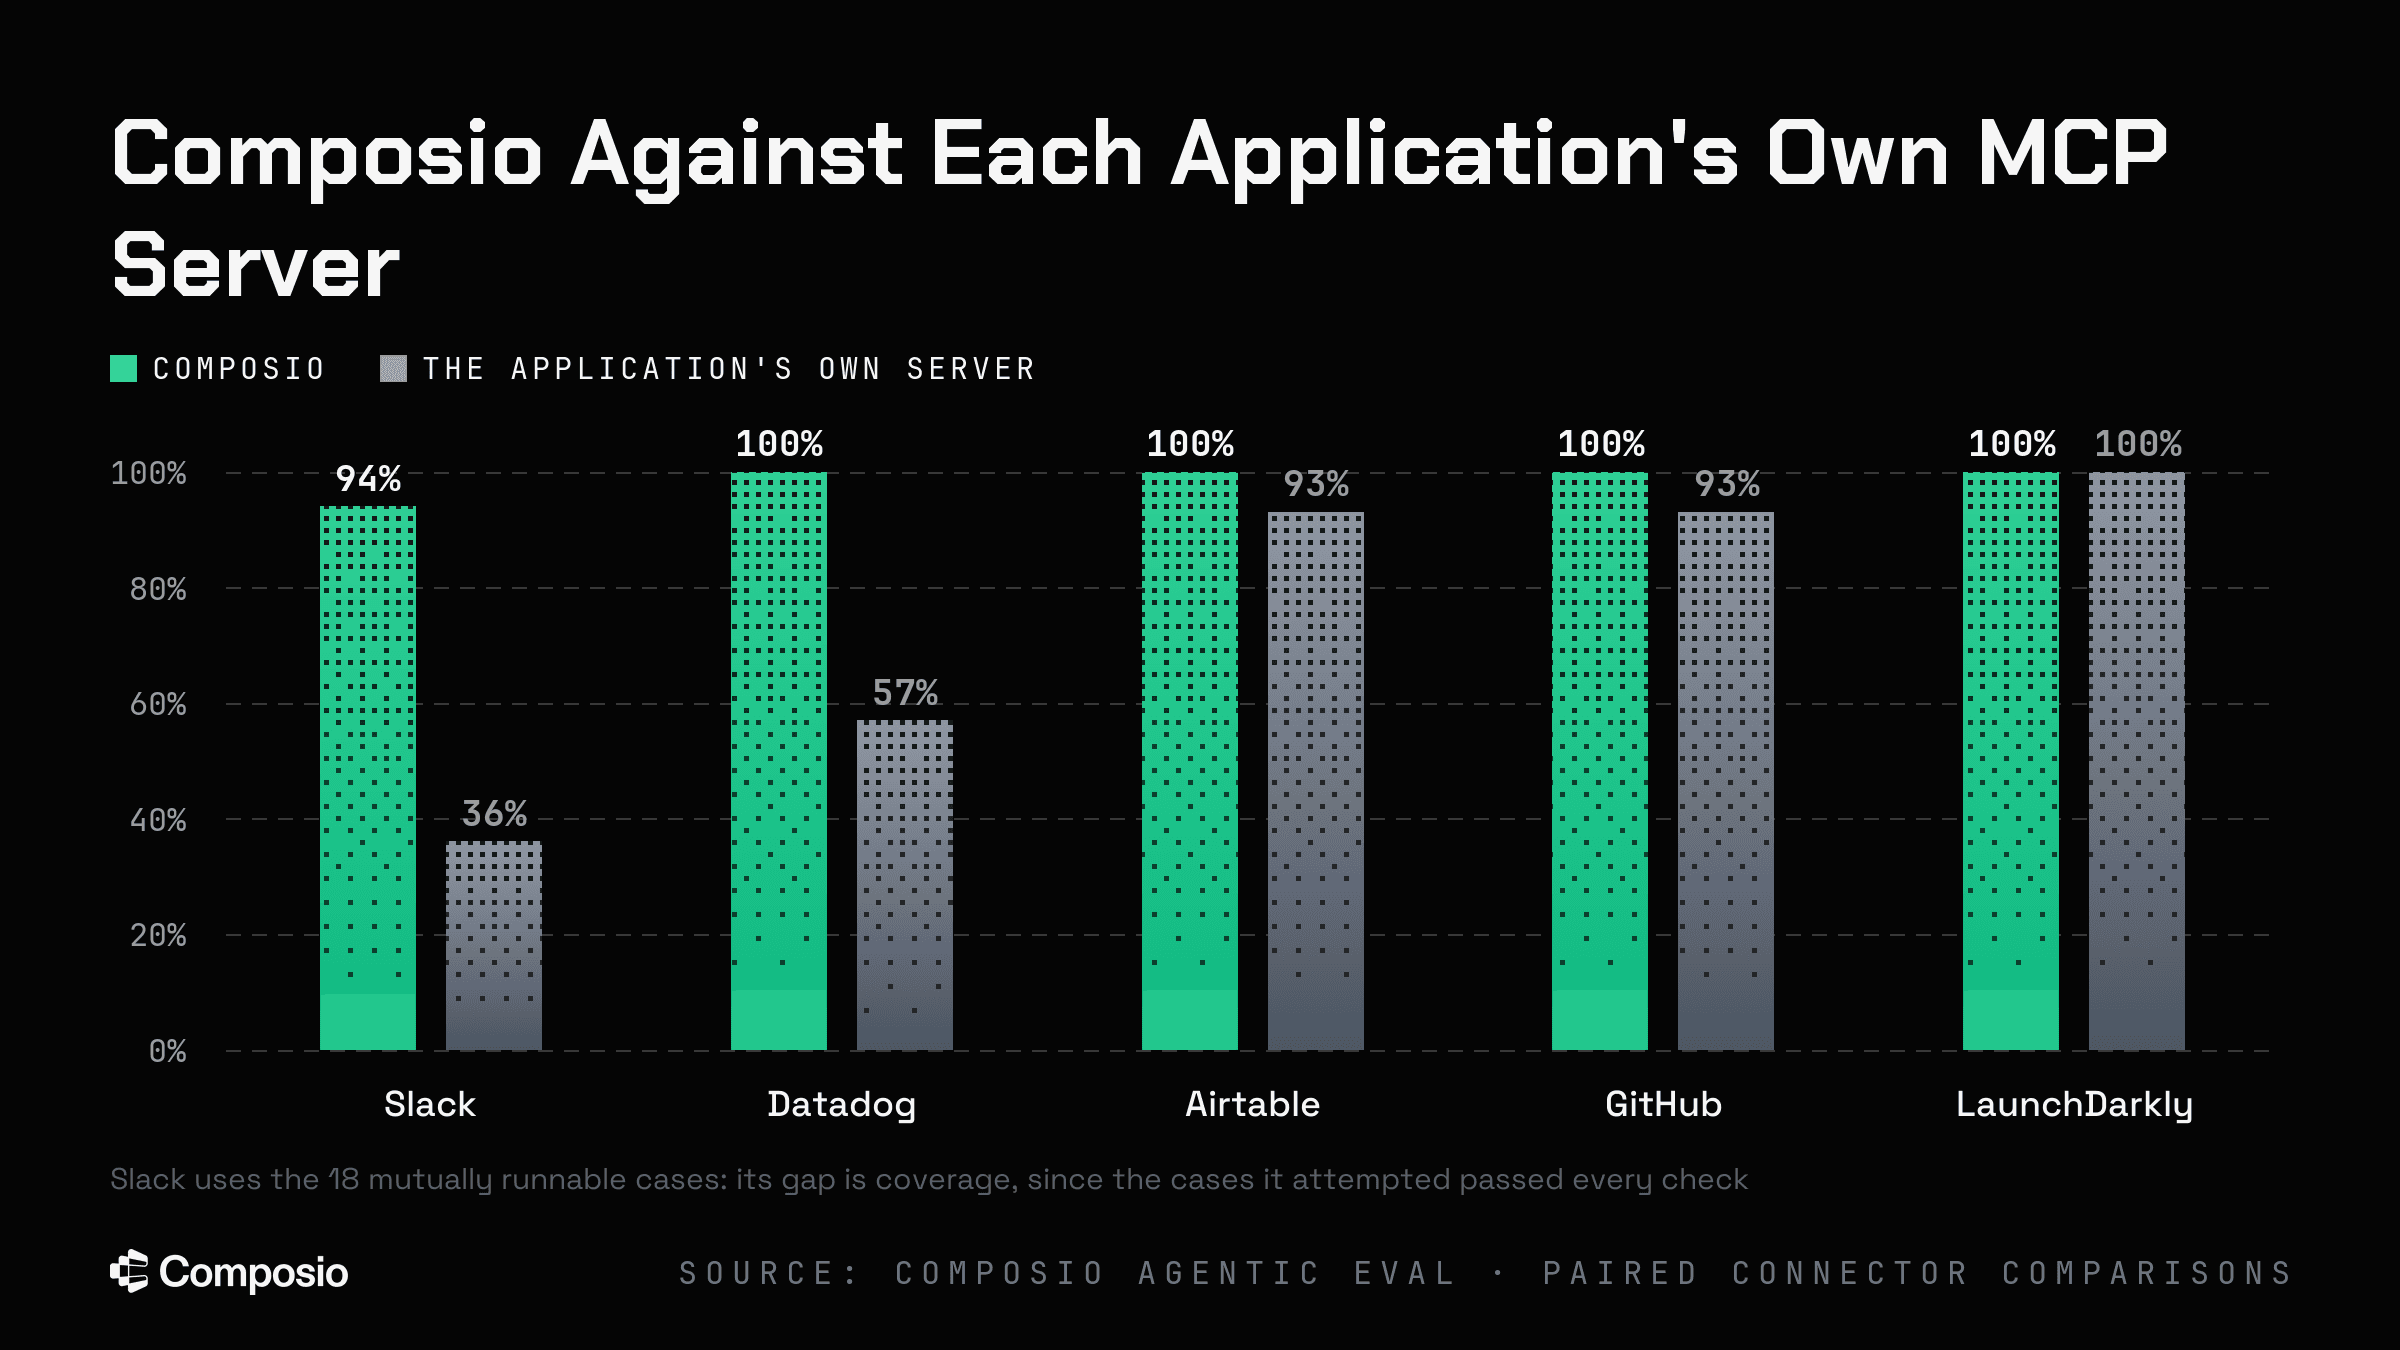
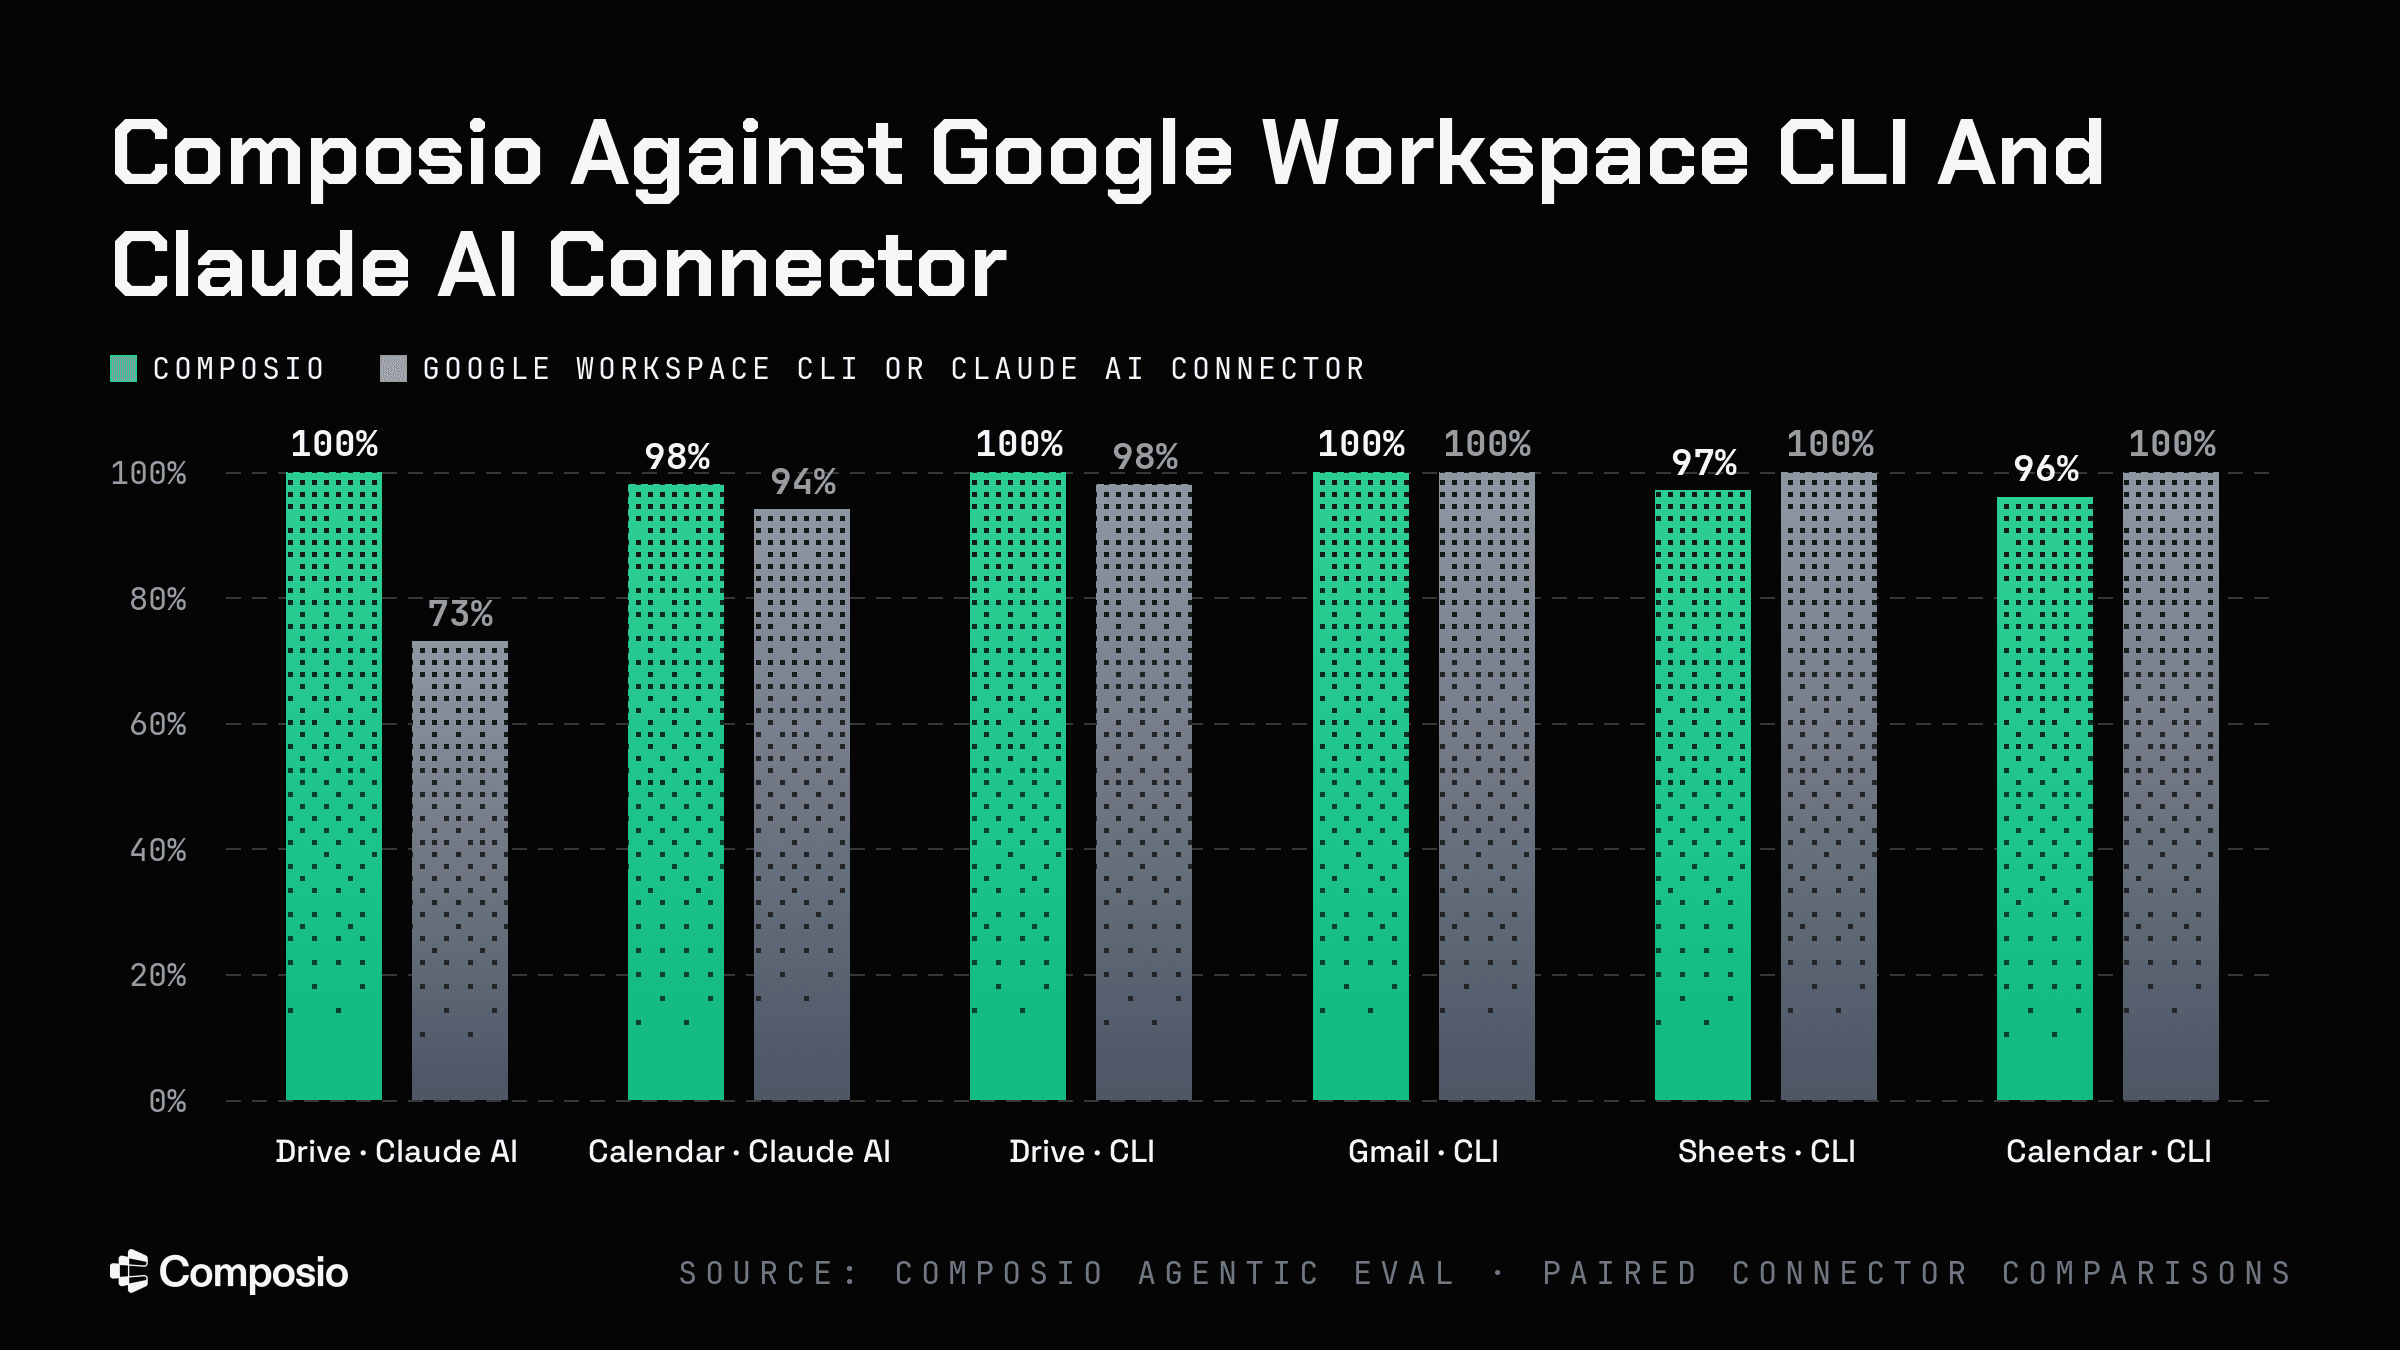
The aggregate is 99% against 86%. The distribution matters more than the mean: seven comparisons favor Composio, two are exact ties, and two favor the partner. The aggregate is driven by a small number of large gaps rather than by a consistent margin.
Slack: Tool coverage and task quality
Slack's official MCP server could attempt only 18 of 50 Slack tasks. Composio attempted all 50 and completed 94%.
On this suite, the alternative attempted a third of the tasks and did them perfectly; the integration layer attempted all of them and did 94% of them correctly. A team whose workload sits inside the 36% the native server covers would see no benefit from the integration layer in outcome quality, and, on the mutually runnable slice, would see the native server at 4.5 turns against Composio's 3.9, with broadly comparable token consumption.
Where native connectors performed better
Four comparisons went against the integration layer, reported here without adjustment.
- Success: Google Sheets against the Google Workspace CLI: 97% versus 100%, one verifier rejection on 37 cases. Google Calendar against the Google Workspace CLI: 96% versus 100%, two verifier rejections on 47 cases. In both cases the native path was flawless and the integration layer was not.
- Token efficiency: GitHub against GitHub's own MCP server: Composio averaged 89,508 full Claude tokens against 81,633 on the 40-case matched slice, 9.6% more. The decomposition is +4,087 cache-read, +3,839 cache-creation, +78 output tokens. Turn counts were effectively equal (4.1 vs 4.2), but the integration layer's agent-visible tool-result history was 65% larger in the recovered pairs, so its cached prefix grew faster once execution began. Wall-clock time also favored the native server substantially, 154.0s against 512.9s. Google Calendar against the Claude AI connector: Composio averaged 100,735 tokens against 88,150, 14.3% more. Of the 12,585-token gap, 11,678 was cache reads; direct output differed by only 488. Composio averaged 4.1 turns against 3.5 and 3.1 recorded calls against 2.5, with near-identical agent-visible tool-result volume. The evidence points to extra exploration and repeated history rather than a larger initial prompt.
Across the ten comparisons with available token data, the integration layer used fewer tokens in eight and more in two. The savings are often large (50.2% on Sheets, 49.3% on Datadog, 30.6% on Drive), but the two increases of 9.6% and 14.3% still matter for individual deployments. A team running primarily GitHub workloads would pay the 9.6% increase, not the average.
What the average leaves out
Across the eleven comparisons, the integration layer outperformed the application's native access path by an average of 13 percentage points in task completion.
Even excluding Slack and Datadog, Composio outperformed native connectors 99% to 95% across the other nine comparisons.
Evaluate the tools available for your applications. The aggregate result can hide both missing tool coverage and cases where the native connector performs better.
Results across five models
Study design: Five model families with two integration setups
Five model families were tested with both hosted Composio MCP and their official native integrations. Each model used the same harness for both setups, with consistent rules for excluding invalid trials. Tasks were selected in advance across three difficulty levels, with 10, 10, and 11 cases respectively.
Results by model
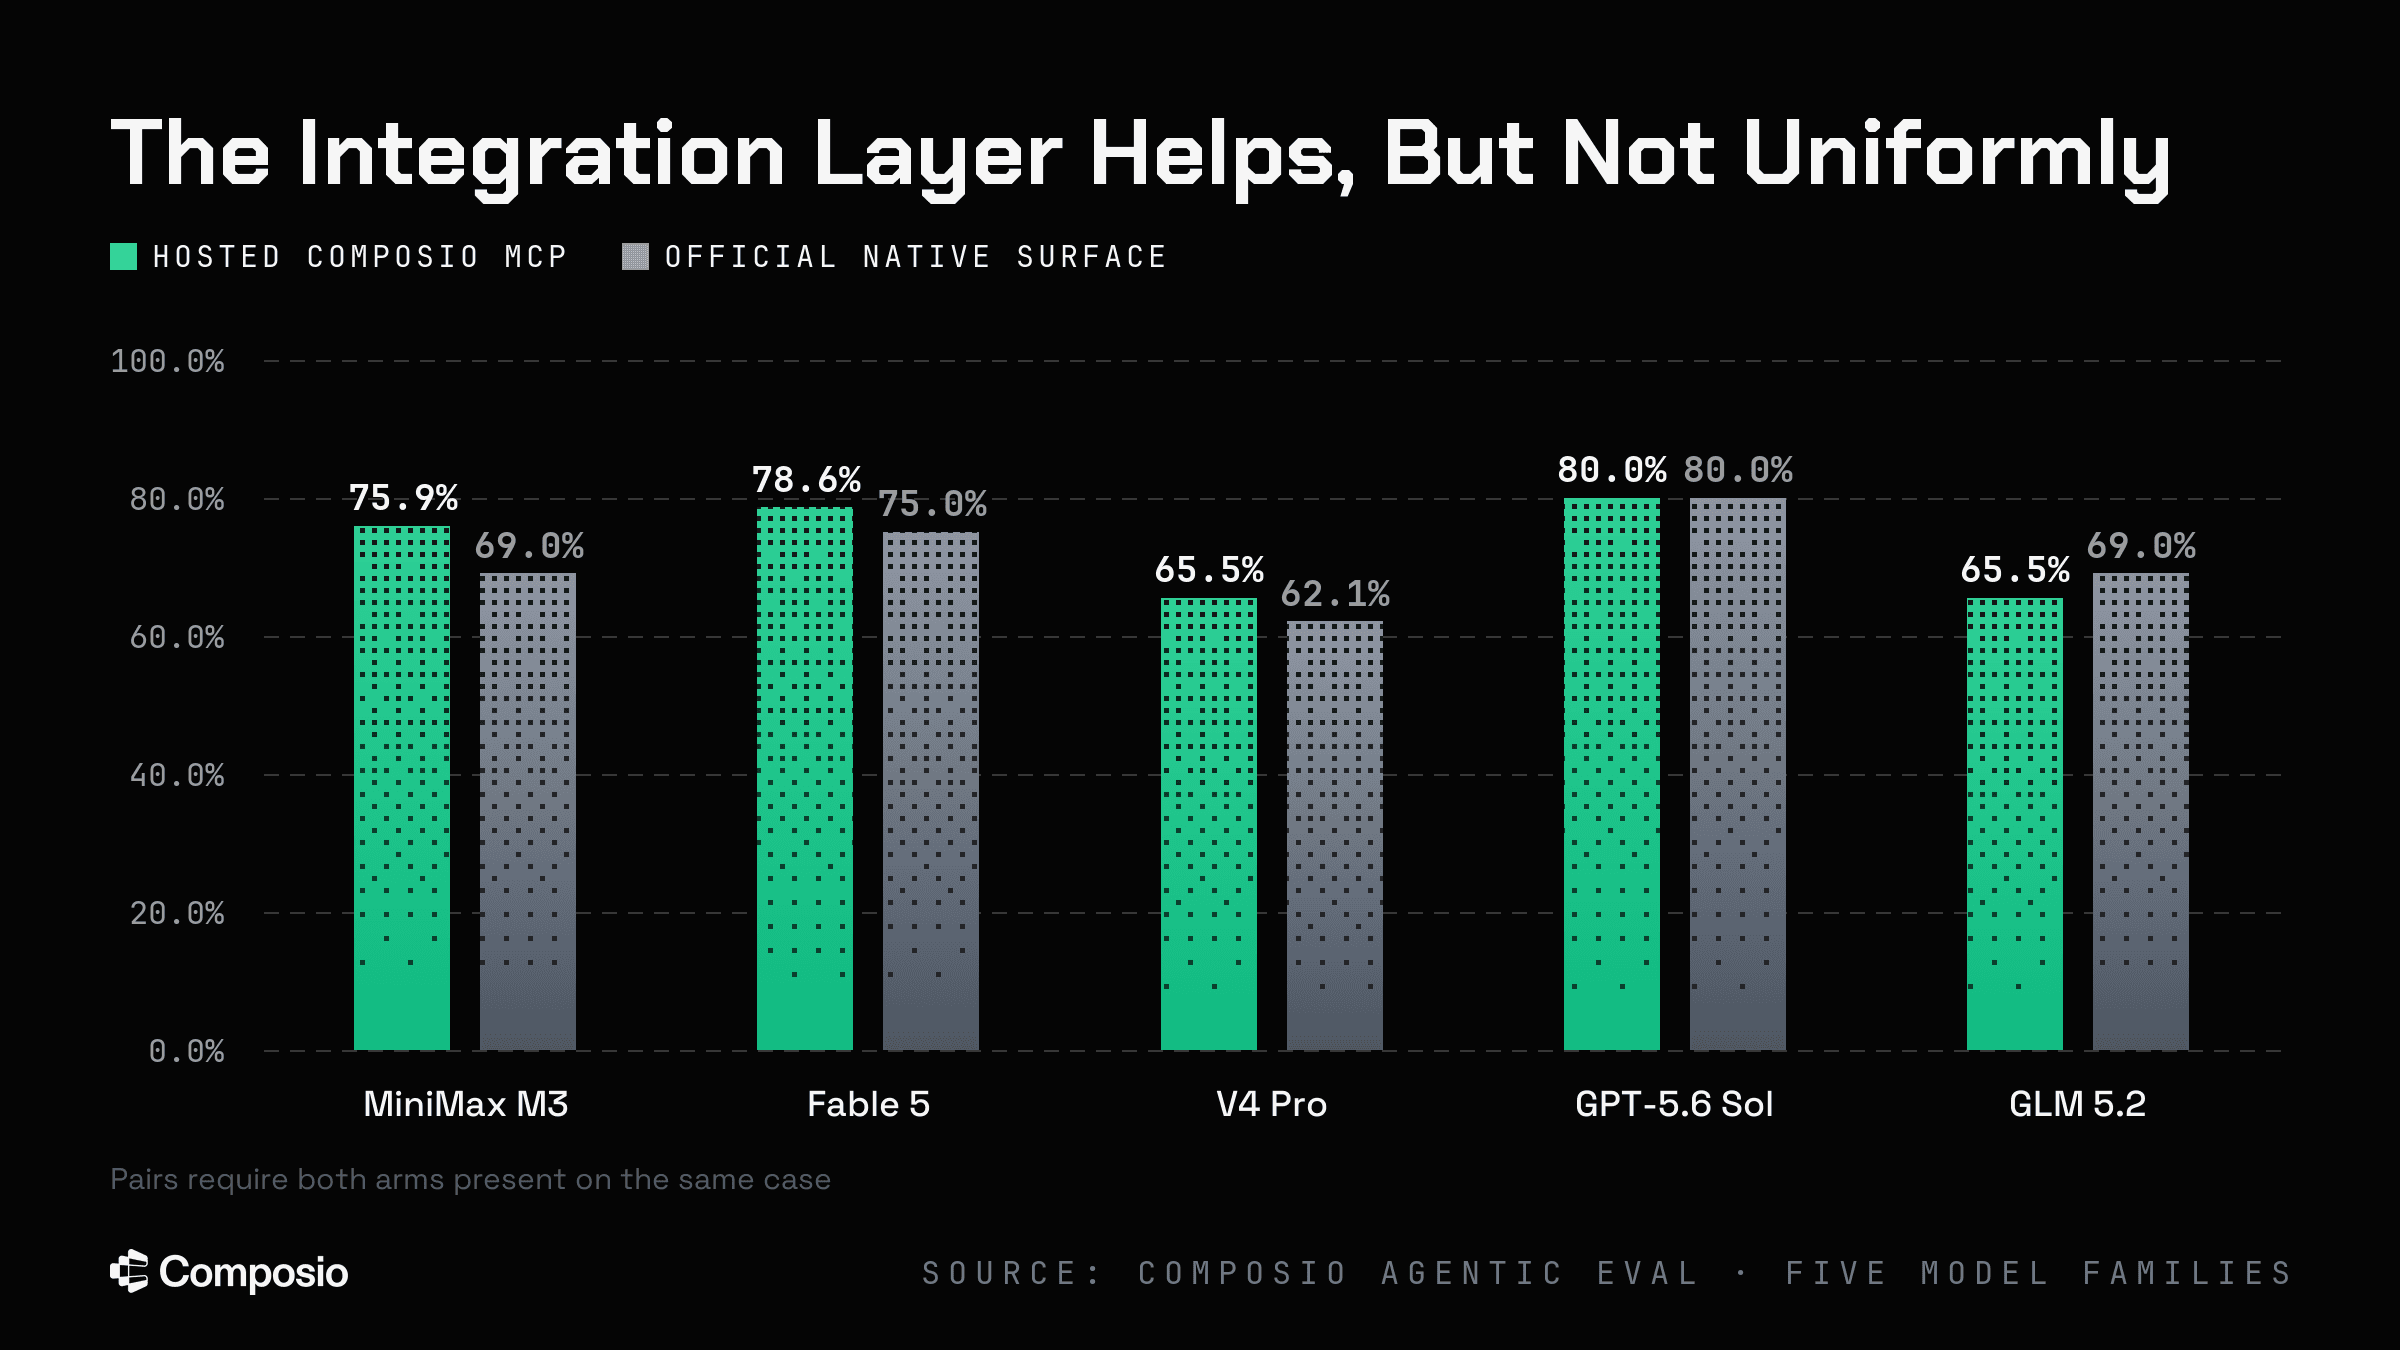
Composio roughly halved the number of tool calls on four of five models, for example, from 23.6 to 10.0 on MiniMax.
Latency mostly improved, with one clear regression. Three models were faster on the Composio arm (DeepSeek 119.0s vs 185.5s; MiniMax 140.4s vs 183.7s; GPT-5.6 Sol 114.5s vs 124.0s), GLM was effectively unchanged, and Fable 5 was substantially slower (171.8s vs 125.4s), consistent with its higher input-token volume, 673,812 against 449,541 on successful trials.
Cost per attempt rose on the Composio arm for two of the three models priced exactly on both arms. MiniMax $0.1039 against $0.0754; DeepSeek $0.0849 against $0.0505. GLM cost nearly the same in both setups, with Composio slightly lower ($0.1404 against $0.1420). Fable 5's native arm and both GPT-5.6 Sol arms could only be priced as bounded ranges and are excluded from this comparison.
| Model | Tool calls (Composio / native) | Failed calls (Composio / native) | Latency (Composio / native) | Cost / attempt (Composio / native) |
|---|---|---|---|---|
| DeepSeek | 6.2 / 12.8 | 0.3 / 0.8 | 119.0s / 185.5s | $0.0849 / $0.0505 |
| GLM | 6 / 13.4 | 0.3 / 0.7 | unchanged / unchanged | $0.1404 / $0.1420 |
| MiniMax | 10 / 23.6 | 1.5 / 1.5 | 140.4s / 183.7s | $0.1039 / $0.0754 |
| Fable 5 | 8.8 / 13.9 | 0.2 / 0.3 | 171.8s / 125.4s | priced as bounded range |
| GPT-5.6 Sol | 8.4 / 5.7 | 0.5 / 0 | 114.5s / 124.0s | priced as bounded range |
What to test in your own agent
A diagnostic framework
If your agent fails tasks or costs too much to run, use a fixed set of representative tasks to test these choices. Track completion rate, cost, and runtime for each setup.
- Test the harness: The harness comparisons showed ~30 percentage points of success and 2.5x to 13.1x cost variation at a fixed model. Run your task set through two or three candidate harnesses on the model you already use. Rankings from another model may not carry over.
- Test the planning configuration: Skill-based planning saved roughly a third of the token budget at identical success in this test. Compare it with no planning and inline planning on your own tasks. Inline planning captured most of the token saving but was the only arm to lose a case.
- Test the integration layer: The integration layer added ~13 points of success in aggregate against native connectors and ~2 points across models. Tool calls fell on four of five models, while latency and cost varied. Evaluate your specific applications: per-application success differences ranged from +58 to −4 points.
- Reconsider the model: Use the earlier tests to identify which failures remain. Then compare models with the same harness, planning setup, and connectors so you can measure what the model change contributes.
Conclusion
Summary of findings
Harness choice affects success and cost: The two evaluations tested nine and six harnesses and found 30 and 7 percentage points of success variation among comparable arms, with cost varying by 2.5x to 13.1x. The rankings differed between models (Spearman rho = 0.48 across six shared harnesses).
Planning changes efficiency: Skill-based planning matched the no-planning baseline at 100% success while using 33.4% fewer tokens, 21.5% fewer turns and 21.8% less time. The baseline already passed every case, so this test couldn't measure whether planning helps on harder tasks.
Connector choice affects task completion: Eleven paired application comparisons averaged 99% success for Composio against 86% for native connectors, largely because of tool coverage. Two comparisons tied, two favored the native connector on success, and two favored it on token consumption.